3,262
Additional women tested or treated
(7.1 per 100 eligible)
(7.1 per 100 eligible)
NCQA-Accredited Health Plans Perform Better in HEDIS® and CMS Star Ratings
NCQA compared Accredited and non-Accredited Medicare Advantage plans on 13 HEDIS® measures and 7 CAHPS® measures in the CMS Star Ratings for Measurement Years 2022–2024. Each finding below links to the underlying data.
More Accredited plans reach 4+ Stars, every year measured.
Accredited plans lead on every measure, by +4 points on average.
What closing the gaps would mean, measure by measure.
Over five years—$174M–$320M a year—if non-Accredited plans matched Accredited plan performance.

Accreditation is associated with stronger outcomes and offers a structured framework that plans use to sustain quality improvement over time. NCQA has set quality standards for health plans for more than 35 years and our Health Plan Accreditation is widely recognized as a rigorous framework for quality improvement and operational excellence.
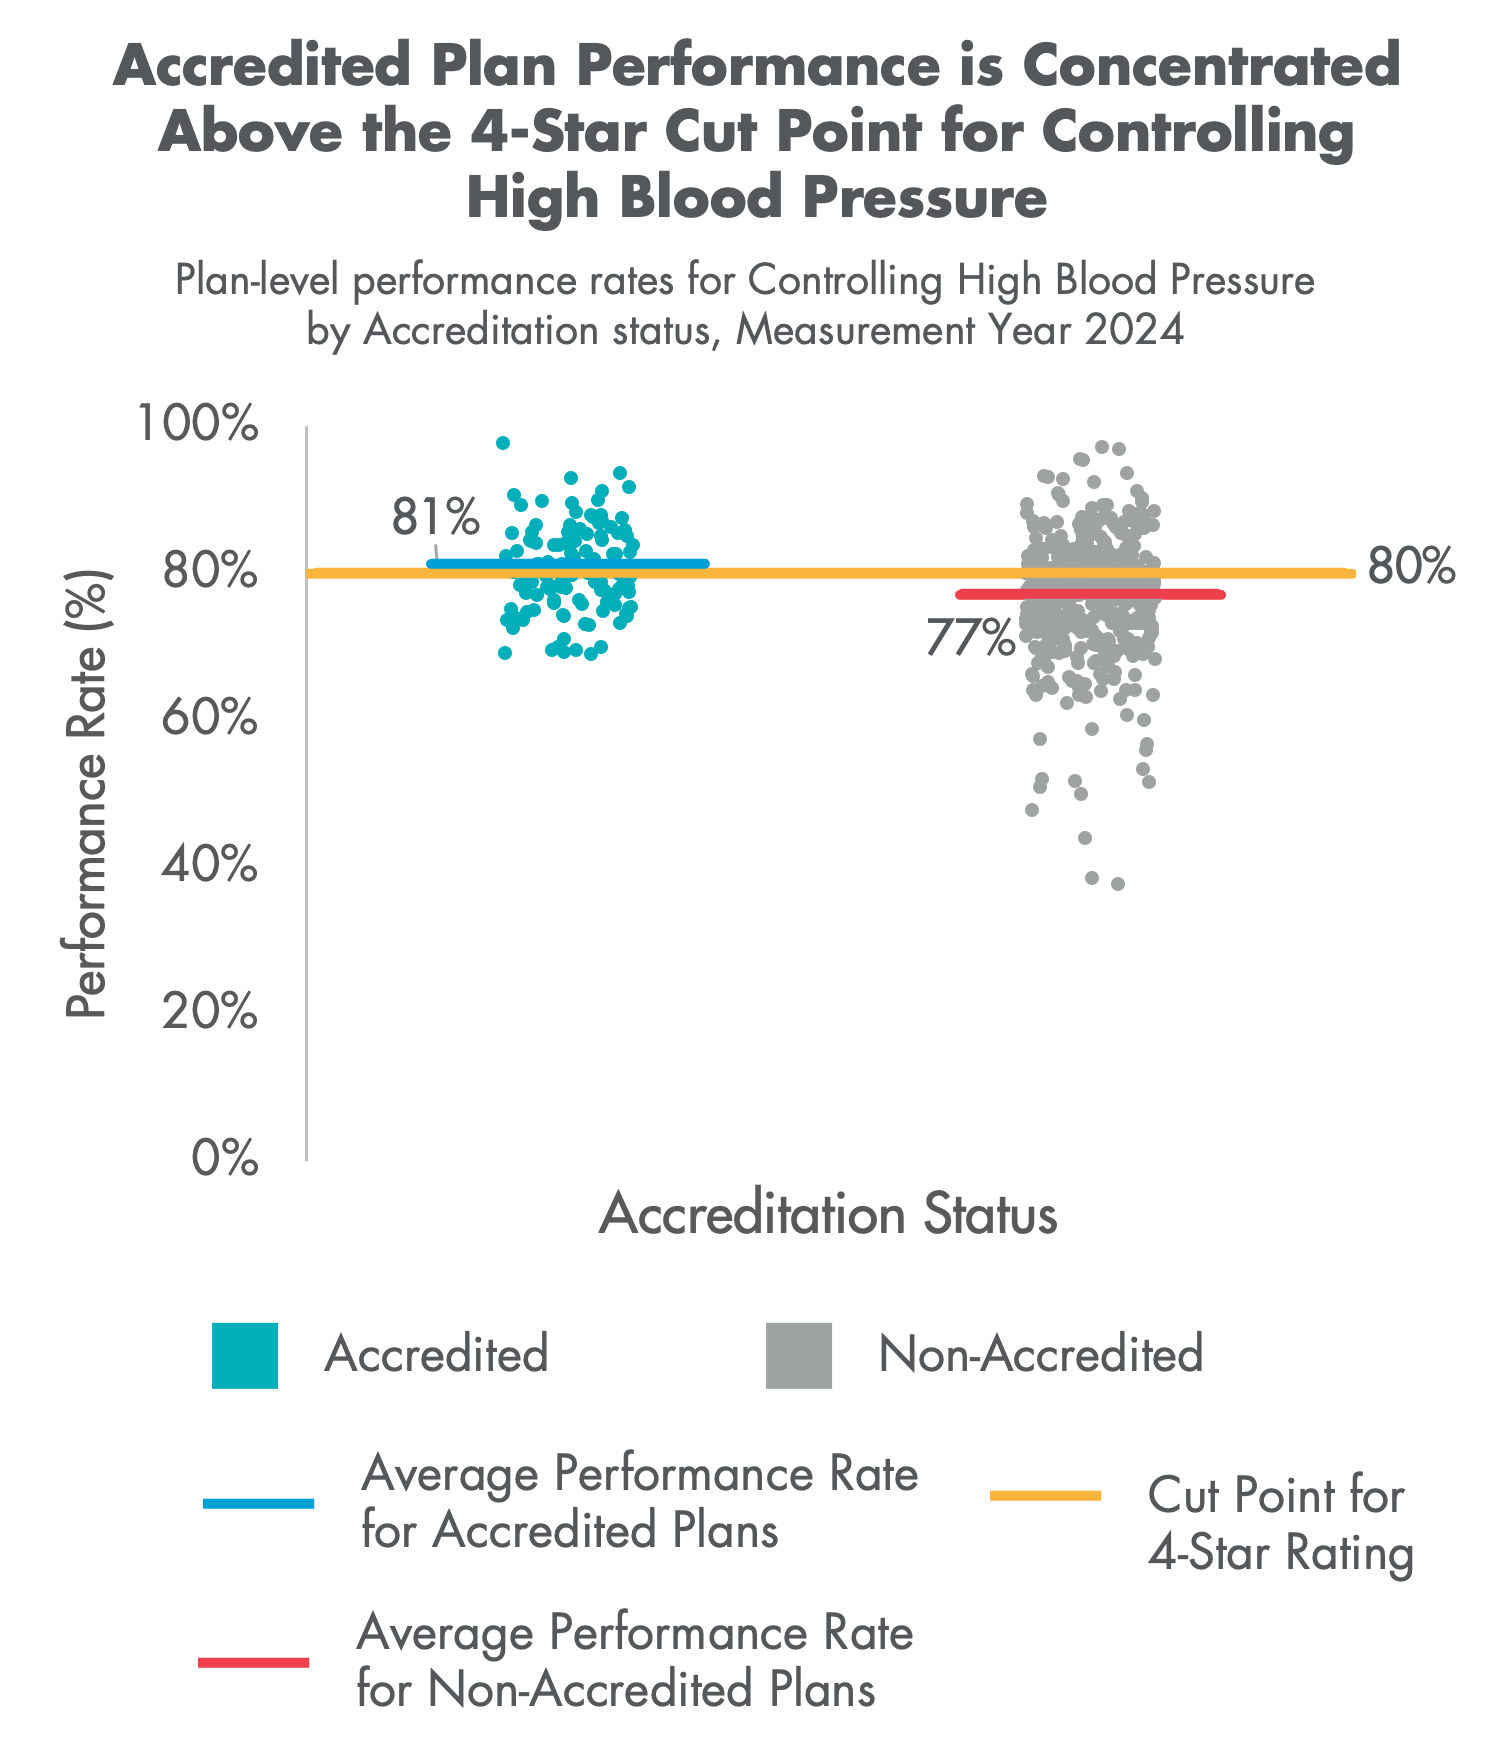
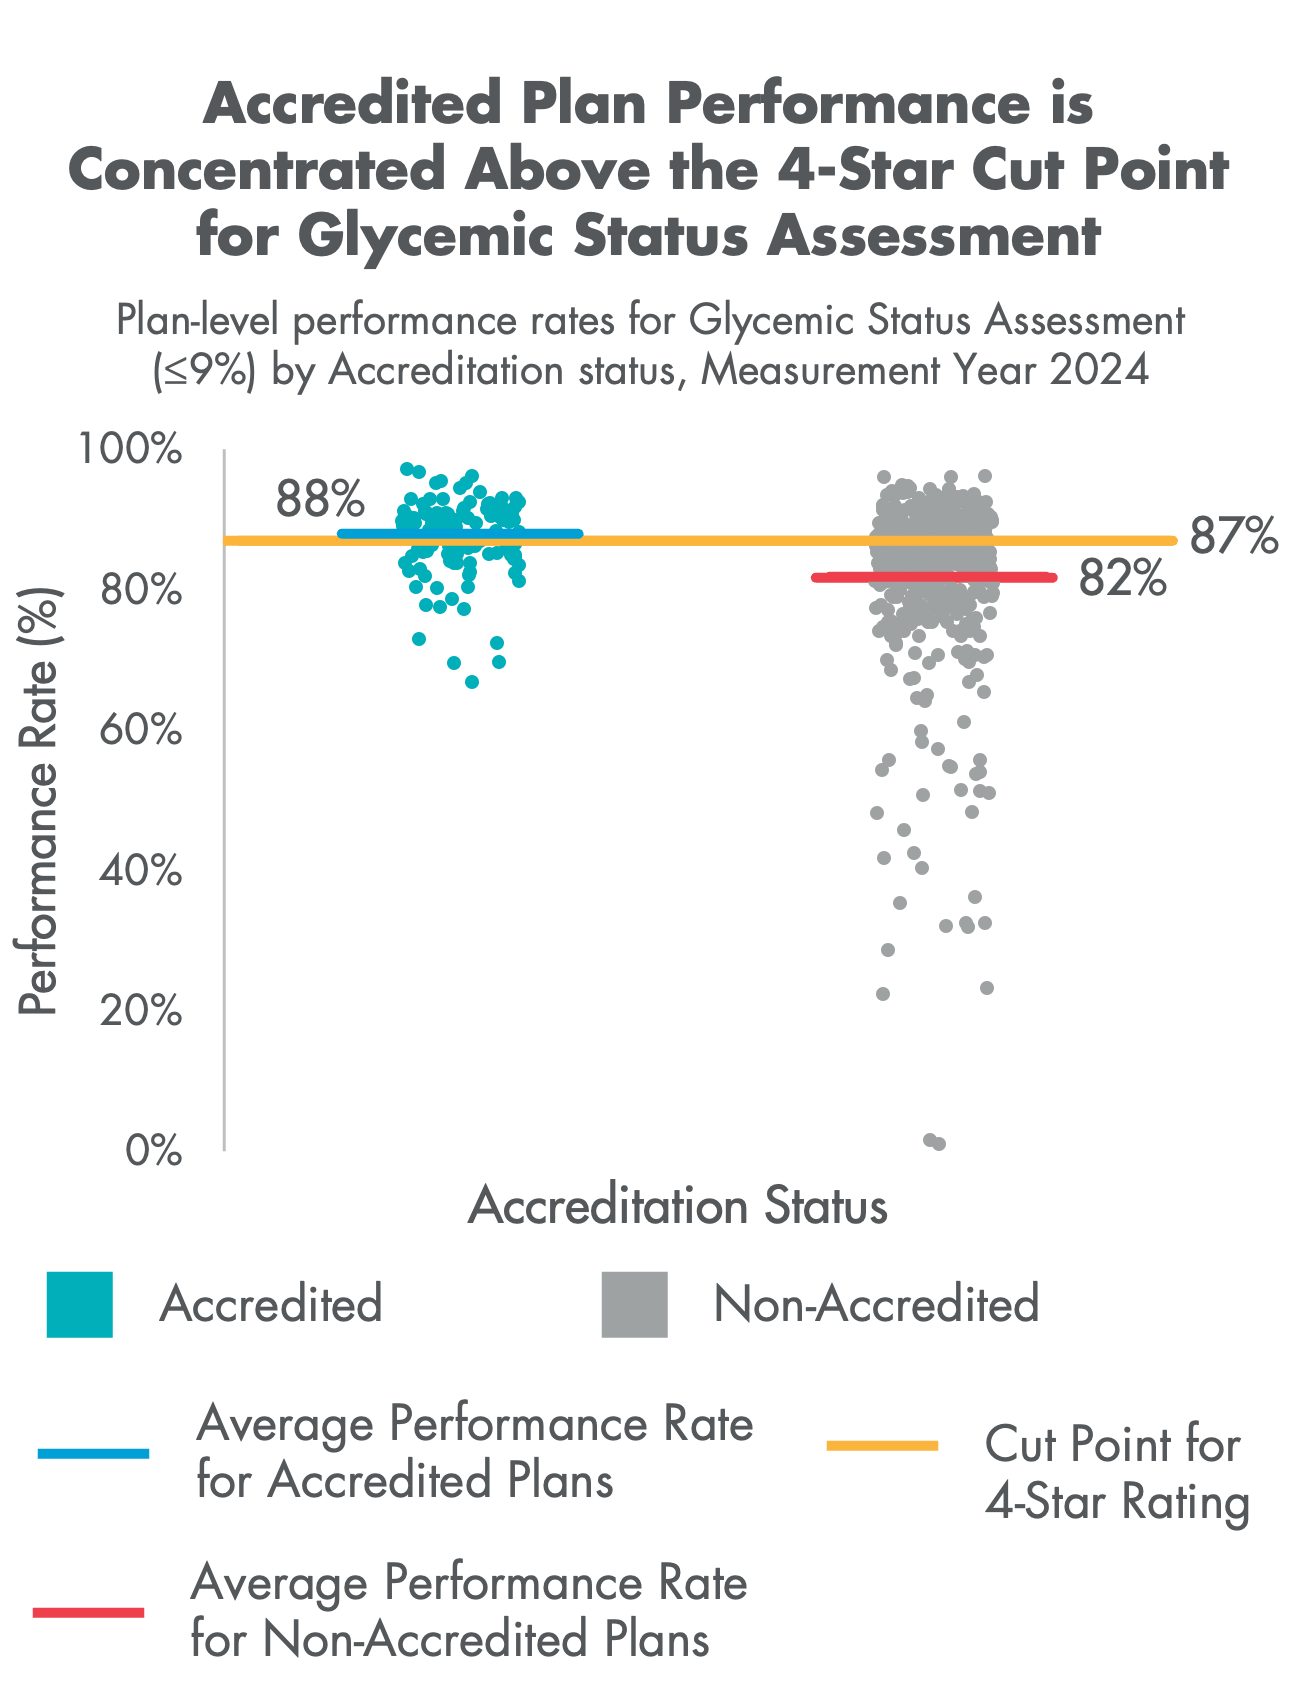
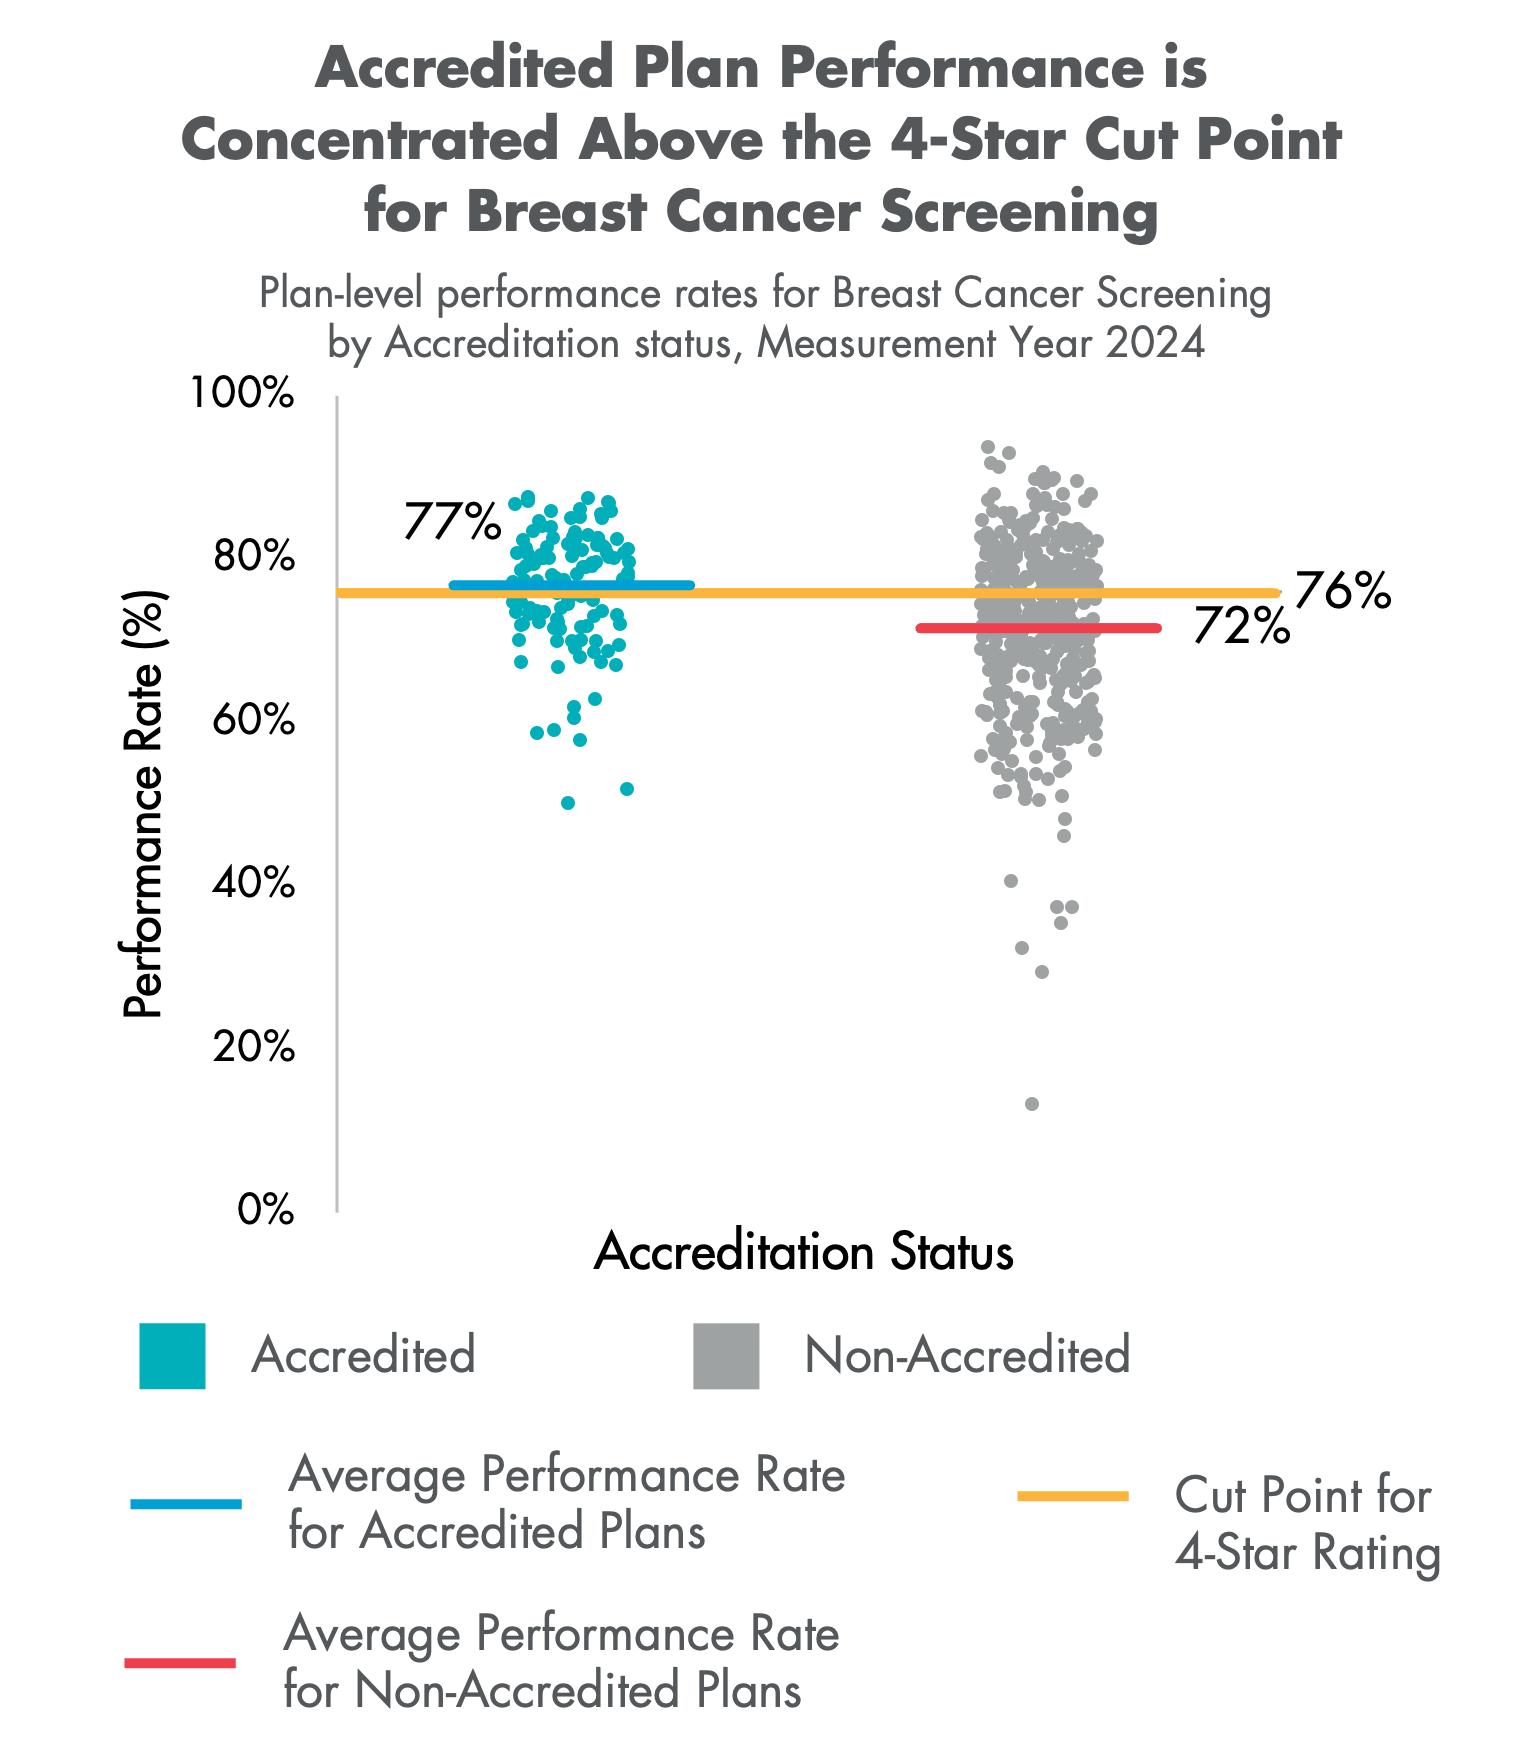
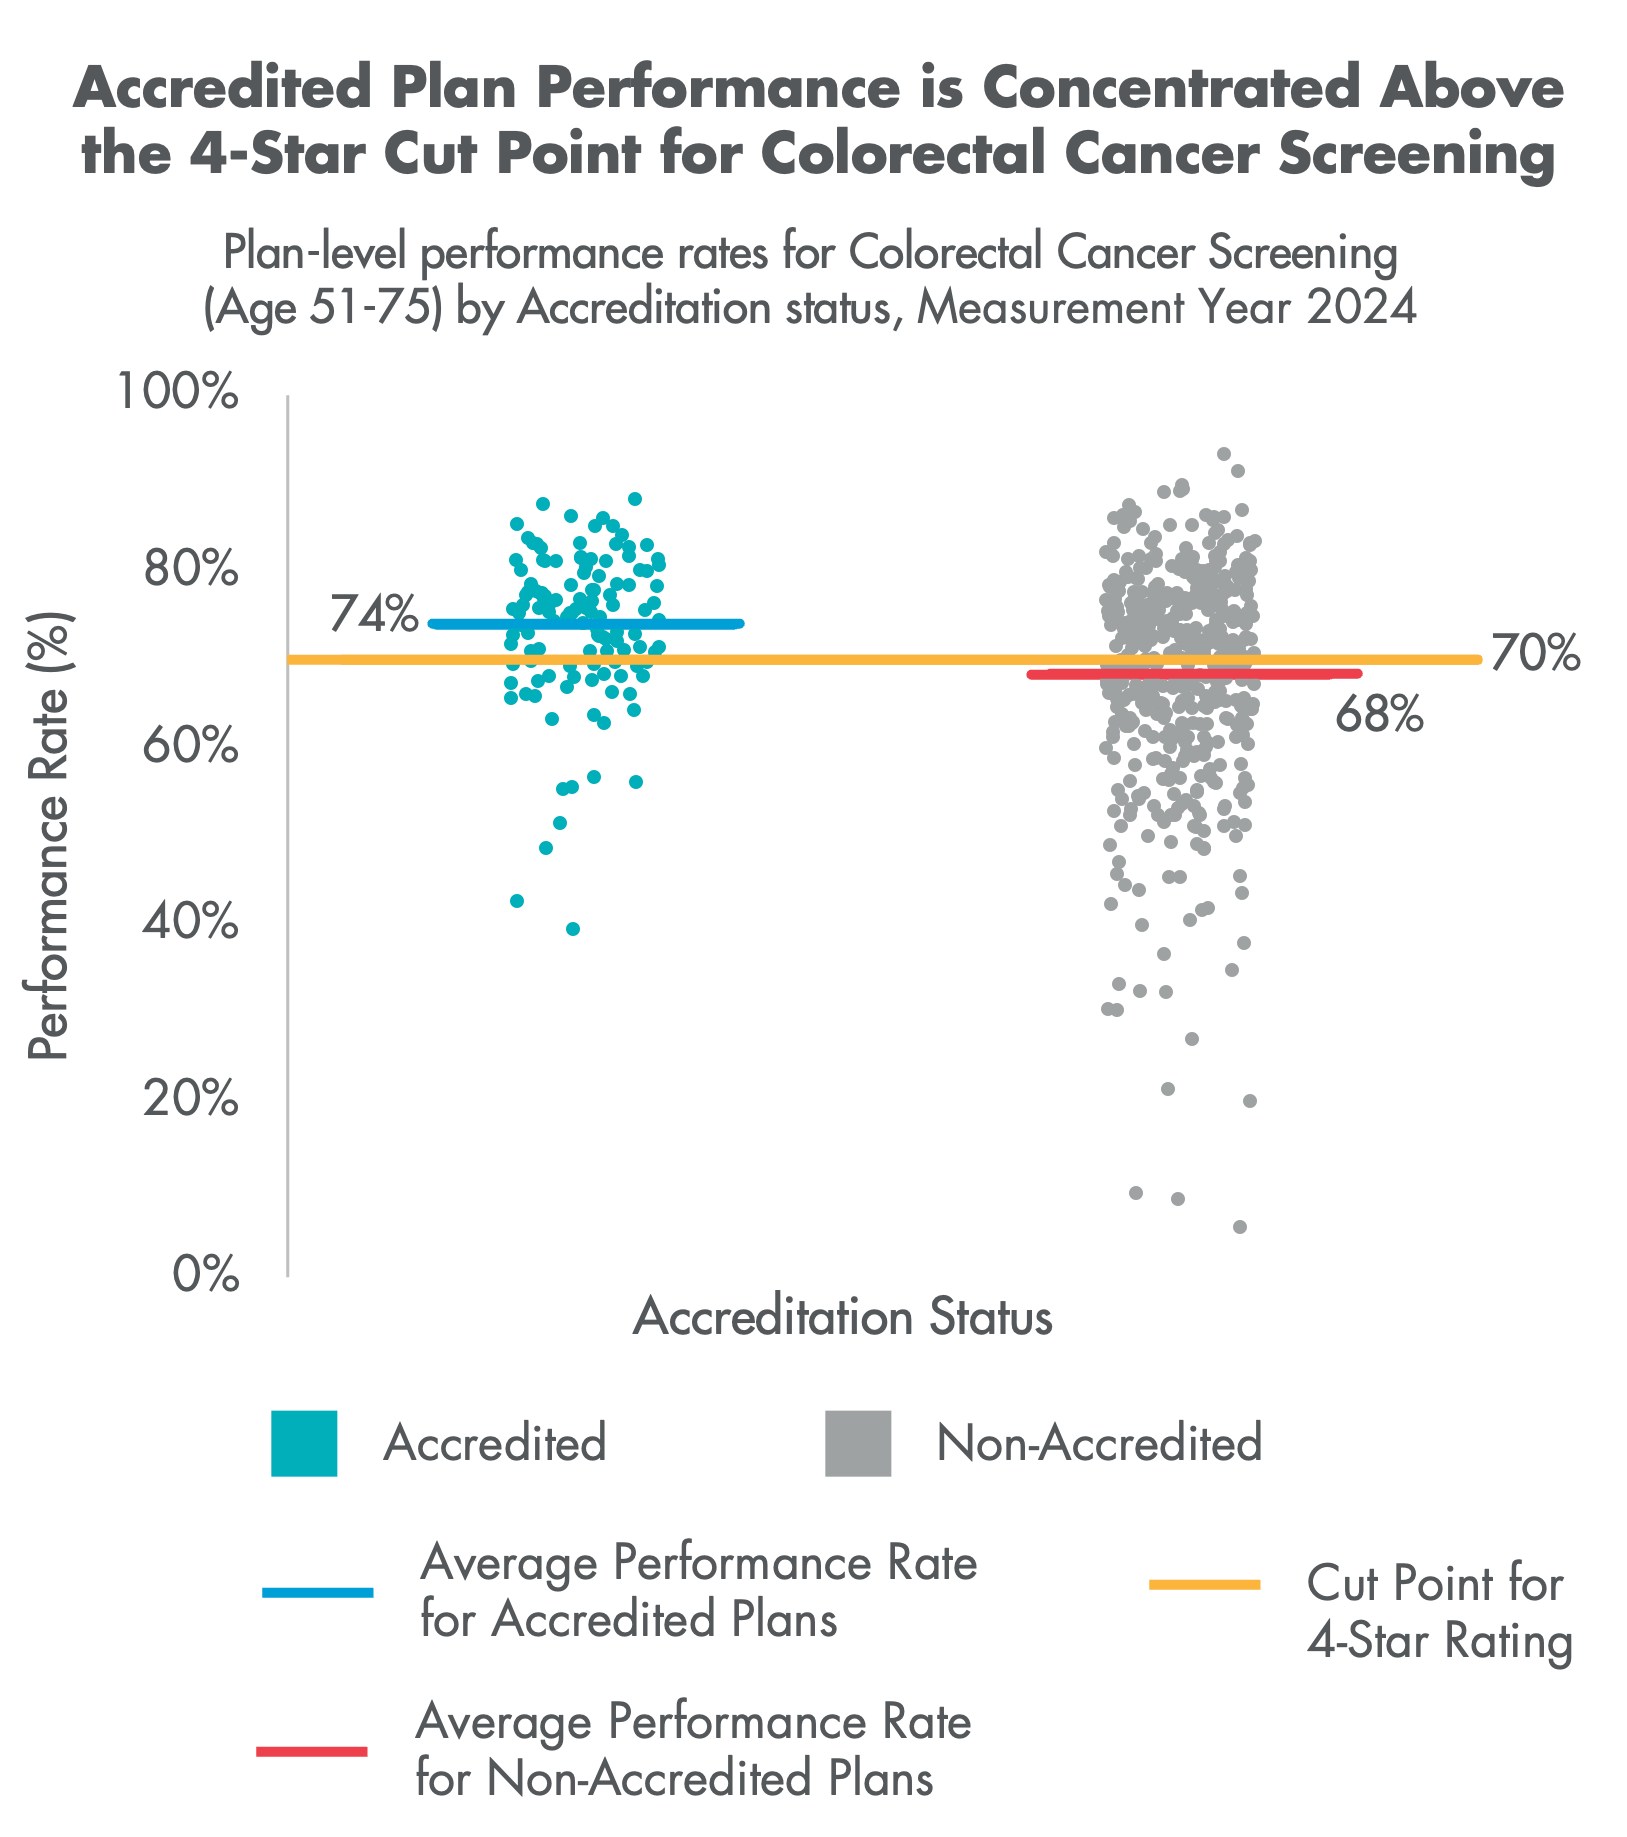
Accredited plans also show fewer low-performing outliers and a greater concentration of plans at higher performance levels.
Source: NCQA Accreditation data and CMS publicly reported Star Ratings performance and Star assignment data.1
HEDIS is one of the most widely used quality measurement frameworks in healthcare. The consistent advantage observed among Accredited plans suggests that Accreditation is associated with the development of performance-improvement capabilities in a systematic and repeatable way.
*Indicates statistically significant differences between Accredited and non-Accredited plan averages for Measurement Year 2024.
^A lower score indicates better performance for this measure. The performance difference is less than 1 percentage point in favor of Accredited plans.
Source: NCQA Accreditation data and performance rate data from HEDIS, stewarded by NCQA (Regression Analysis Method).
CMS establishes performance thresholds, known as cut points, that determine Star Ratings at the individual measure level. Performance on these measures contributes to the overall Star Rating, making movement around key cut points particularly important.
Accredited plan averages exceeded the 4-Star cut point for eight measures in Measurement Year 2024, versus only one measure for non-Accredited plans.
Accredited plans show fewer low-performing outliers and a greater concentration of plans at higher performance levels, as shown in the example below for Glycemic Status Assessment for Patients with Diabetes, a triple-weighted measure in the Star Ratings for Measurement Year 2024.
Source: NCQA Accreditation data and CMS publicly reported Star Ratings performance and Star assignment data.1
Differences in performance translate to real-world impact in terms of care gaps closed, Medicare costs averted and lives saved.
| HEDIS Measure | Additional Members Reaching Target | Clinical Outcomes |
|---|---|---|
| Breast Cancer Screening | 128K(5.1 per 100 eligible) | 51–154Cancers detected in earlier stages |
| Colorectal Cancer Screening | 328K(5.7 per 100 eligible) | 295–656Cancers prevented and 134–524 cases caught earlier |
| Controlling High Blood Pressure | 186K(3.4 per 100 eligible) | 780–1,801Heart failure events and strokes prevented |
| Eye Exam for Patients With Diabetes | 149K(5.9 per 100 eligible) | 149–804Vision loss cases prevented |
| Glycemic Status Assessment for Patients With Diabetes | 144K(5.7 per 100 eligible) | 433–866Progressions to chronic kidney disease, 289–577 acute myocardial infarctions and 72–217 dialysis years prevented |
| Kidney Health Evaluation for Patients With Diabetes | 197K(5.9 per 100 eligible) | 197–983Years of dialysis prevented |
| Follow-Up After Emergency Department Visit – Multiple Chronic Conditions | 33K(1.7 per 100 eligible) | 82–655Emergency department revisits and admissions prevented |
| Osteoporosis Management In Women Who Had a Fracture | 3,262(7.1 per 100 eligible) | 34–65Fractures prevented in older women |
| Plan All-Cause Readmissions | 5,254(0.3 per 100 eligible) | 5,254Avoidable readmissions prevented |
| Statin Therapy | 7,987(1.2 per 100 eligible) | 80–112Recurrent cardiovascular events prevented |
| Transitions of Care | 156K(5.8 per 100 eligible) | 1,641–4,690Readmissions prevented |
Source: Real-world impact calculation inputs are based on findings from research studies related to the HEDIS measures in the CMS Star Ratings (Distribution Shift Impact Method). All studies are referenced on our methods page at: https://www.ncqa.org/accreditation-advantage-methods.

Select a measure to compare performance between Accredited and non-Accredited plans and discover what it could mean if non-Accredited plans performed at the same level as Accredited plans. Results displayed are for Measurement Year 2024.
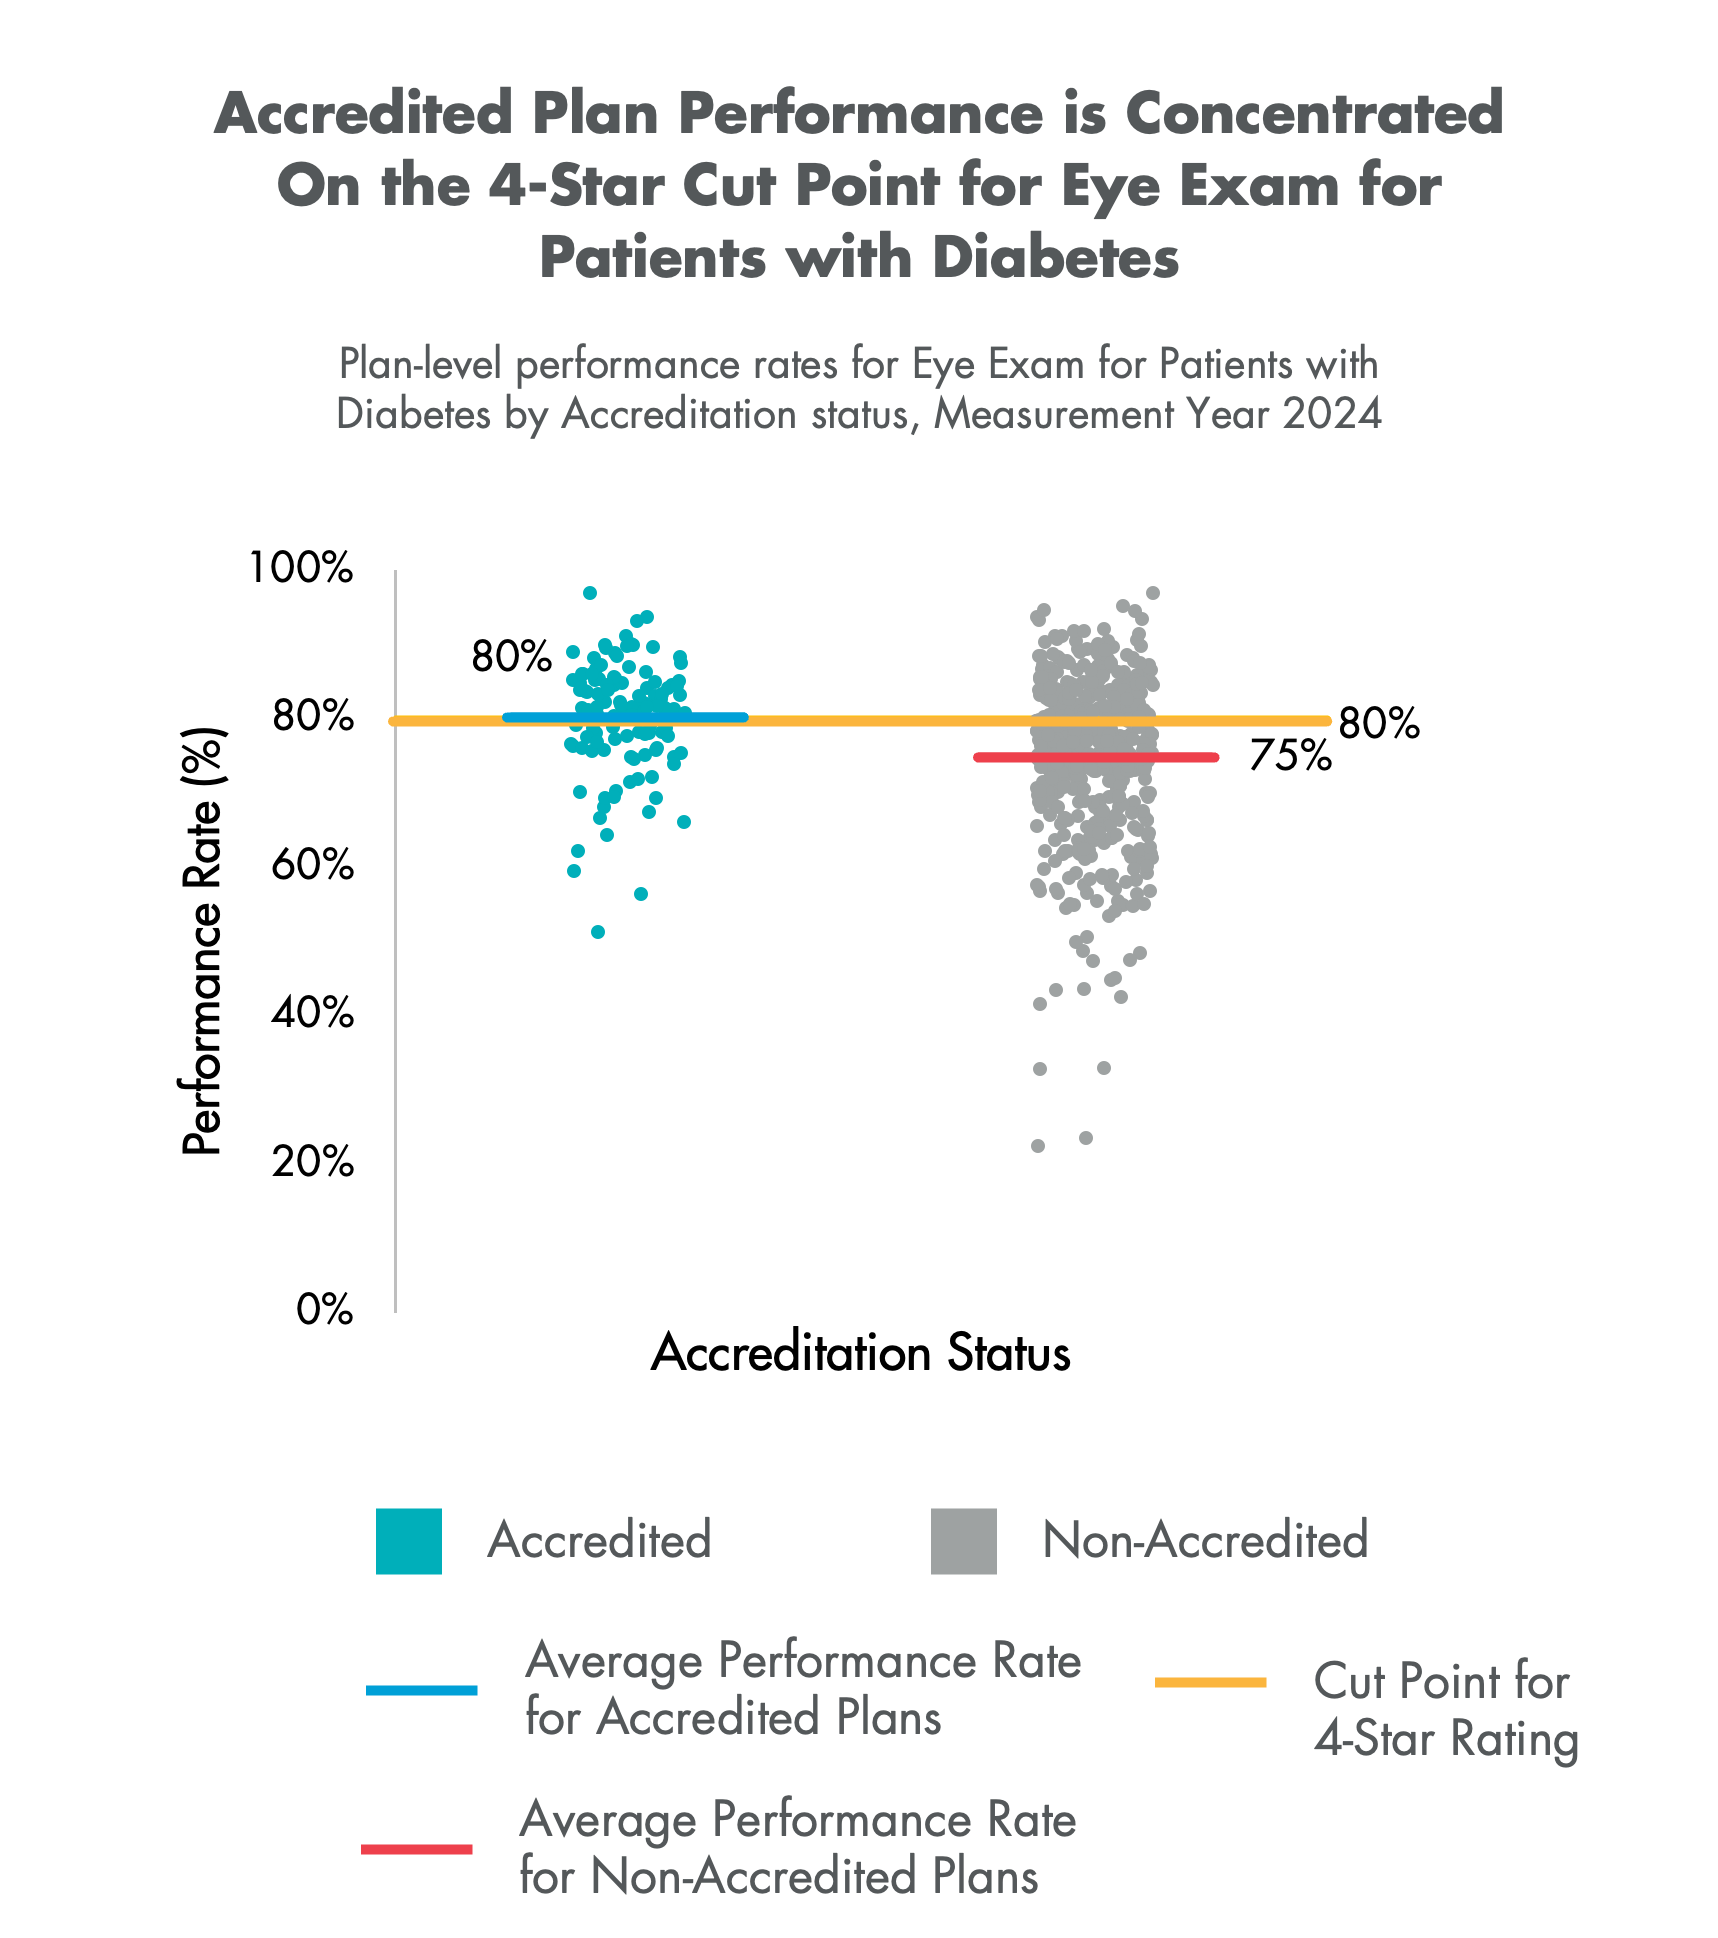
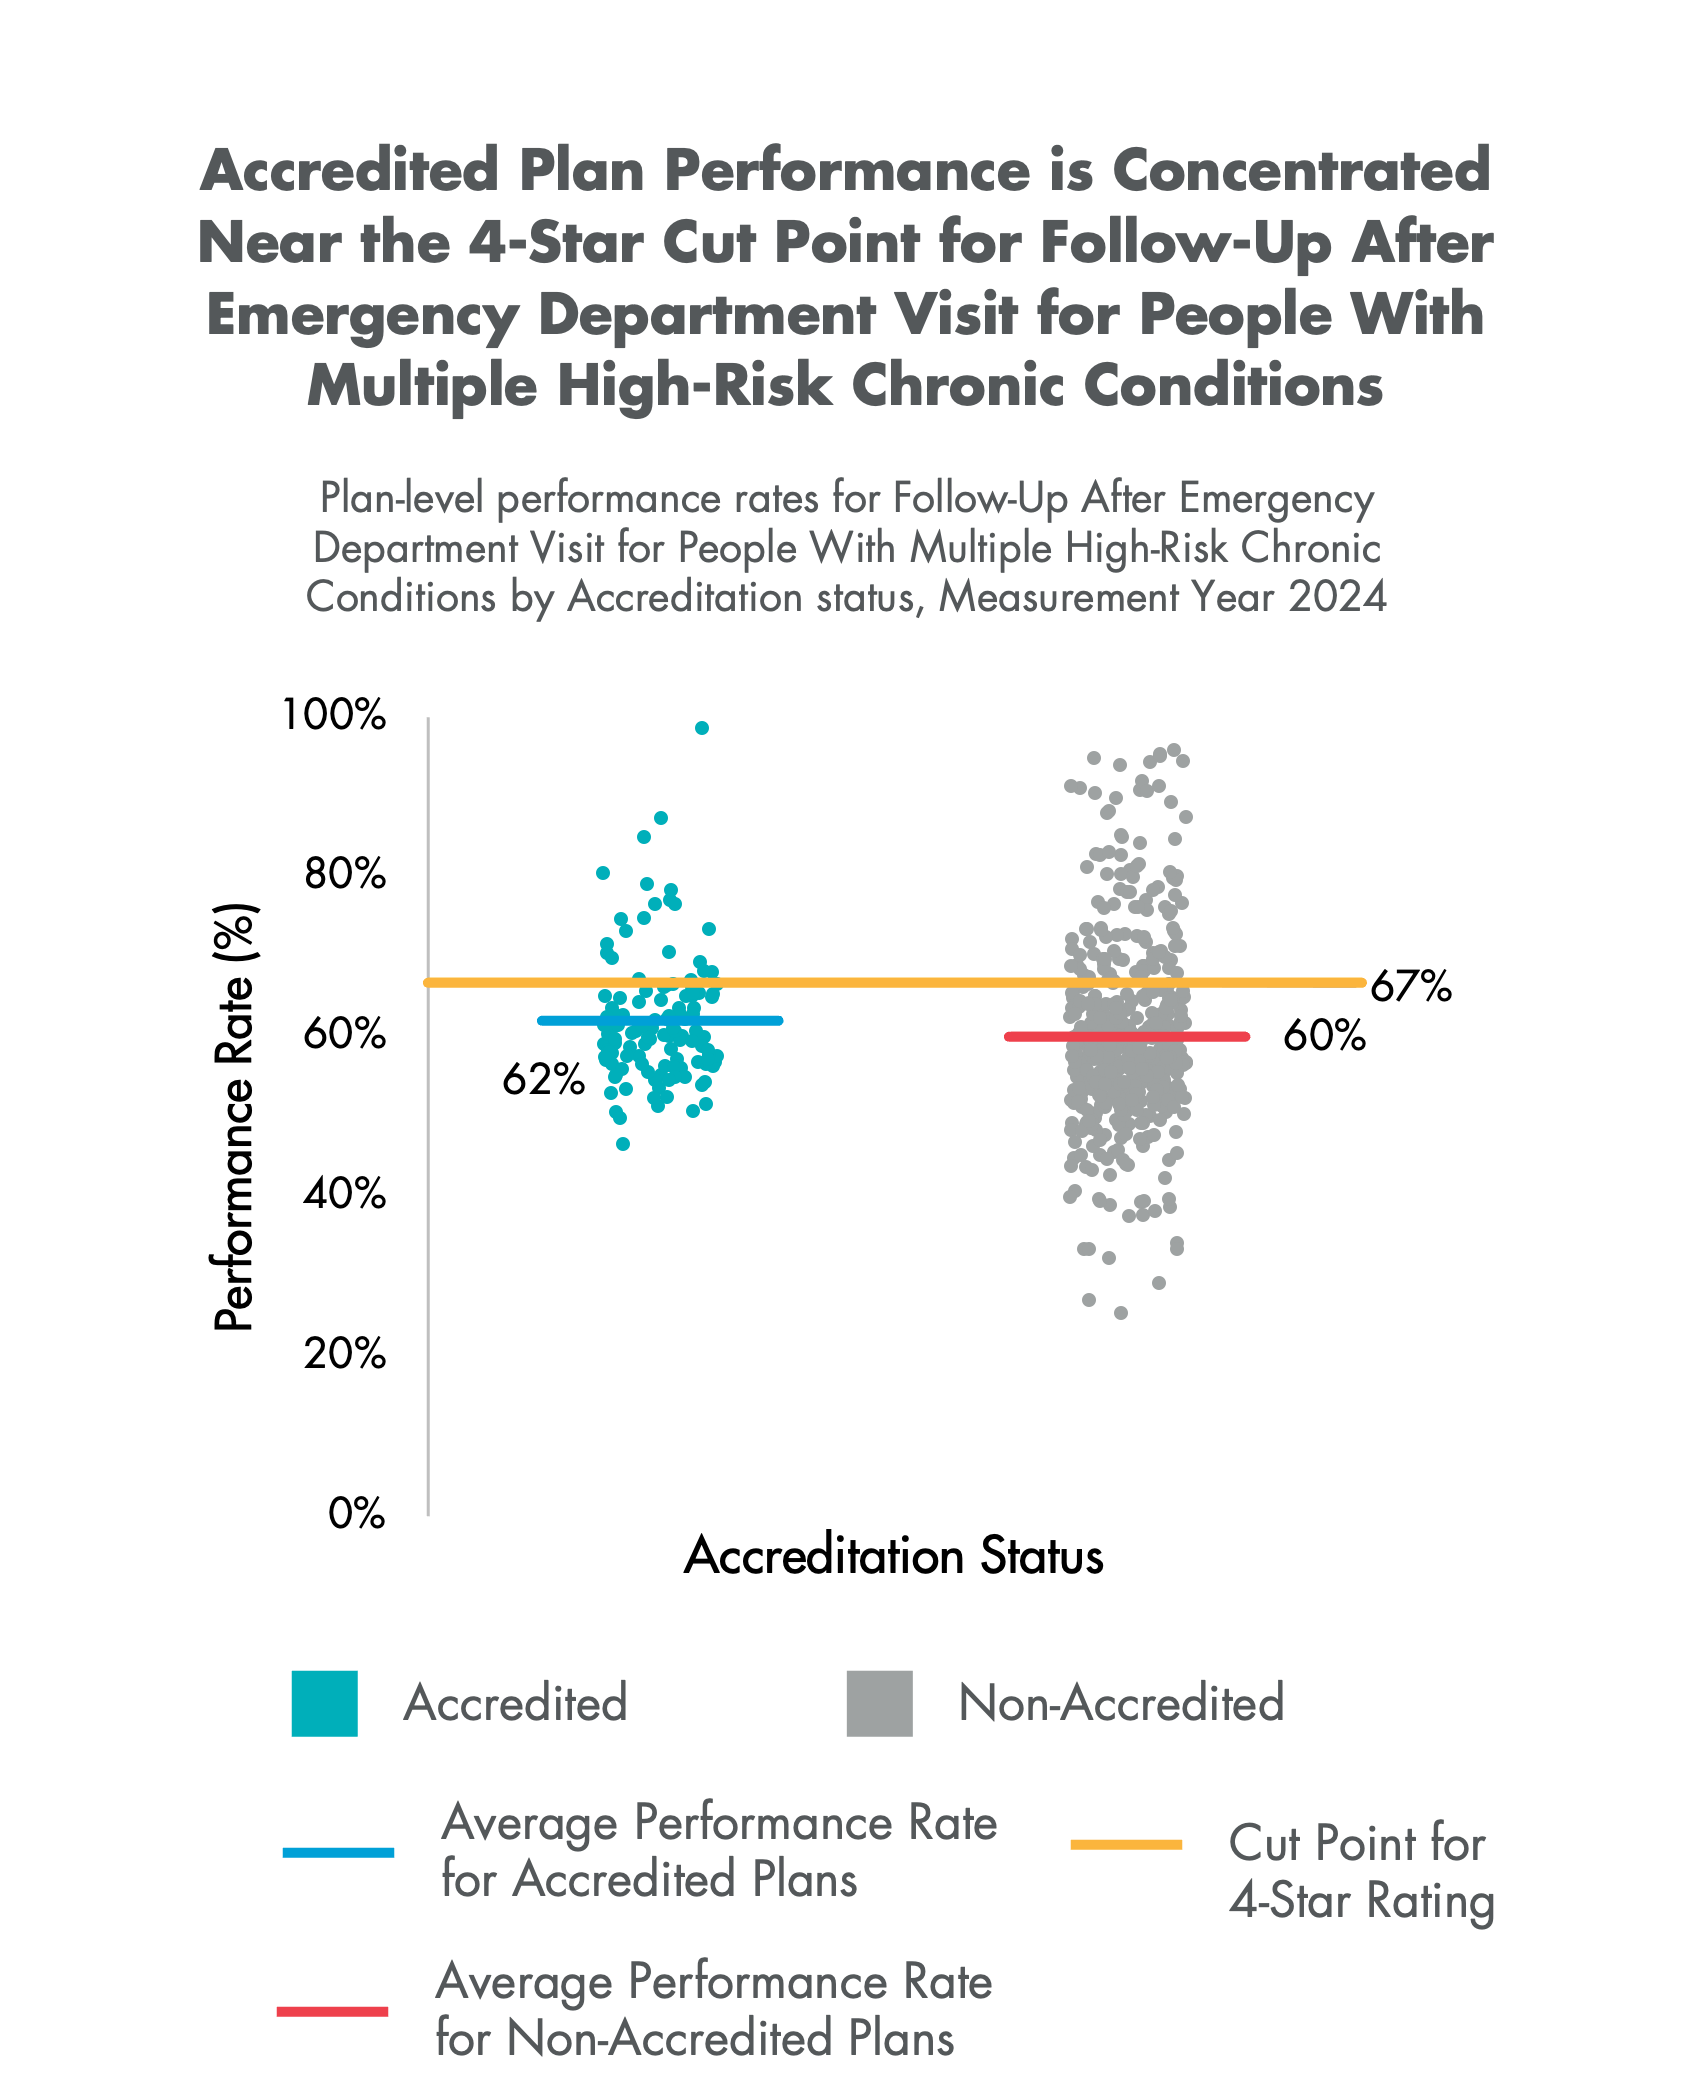
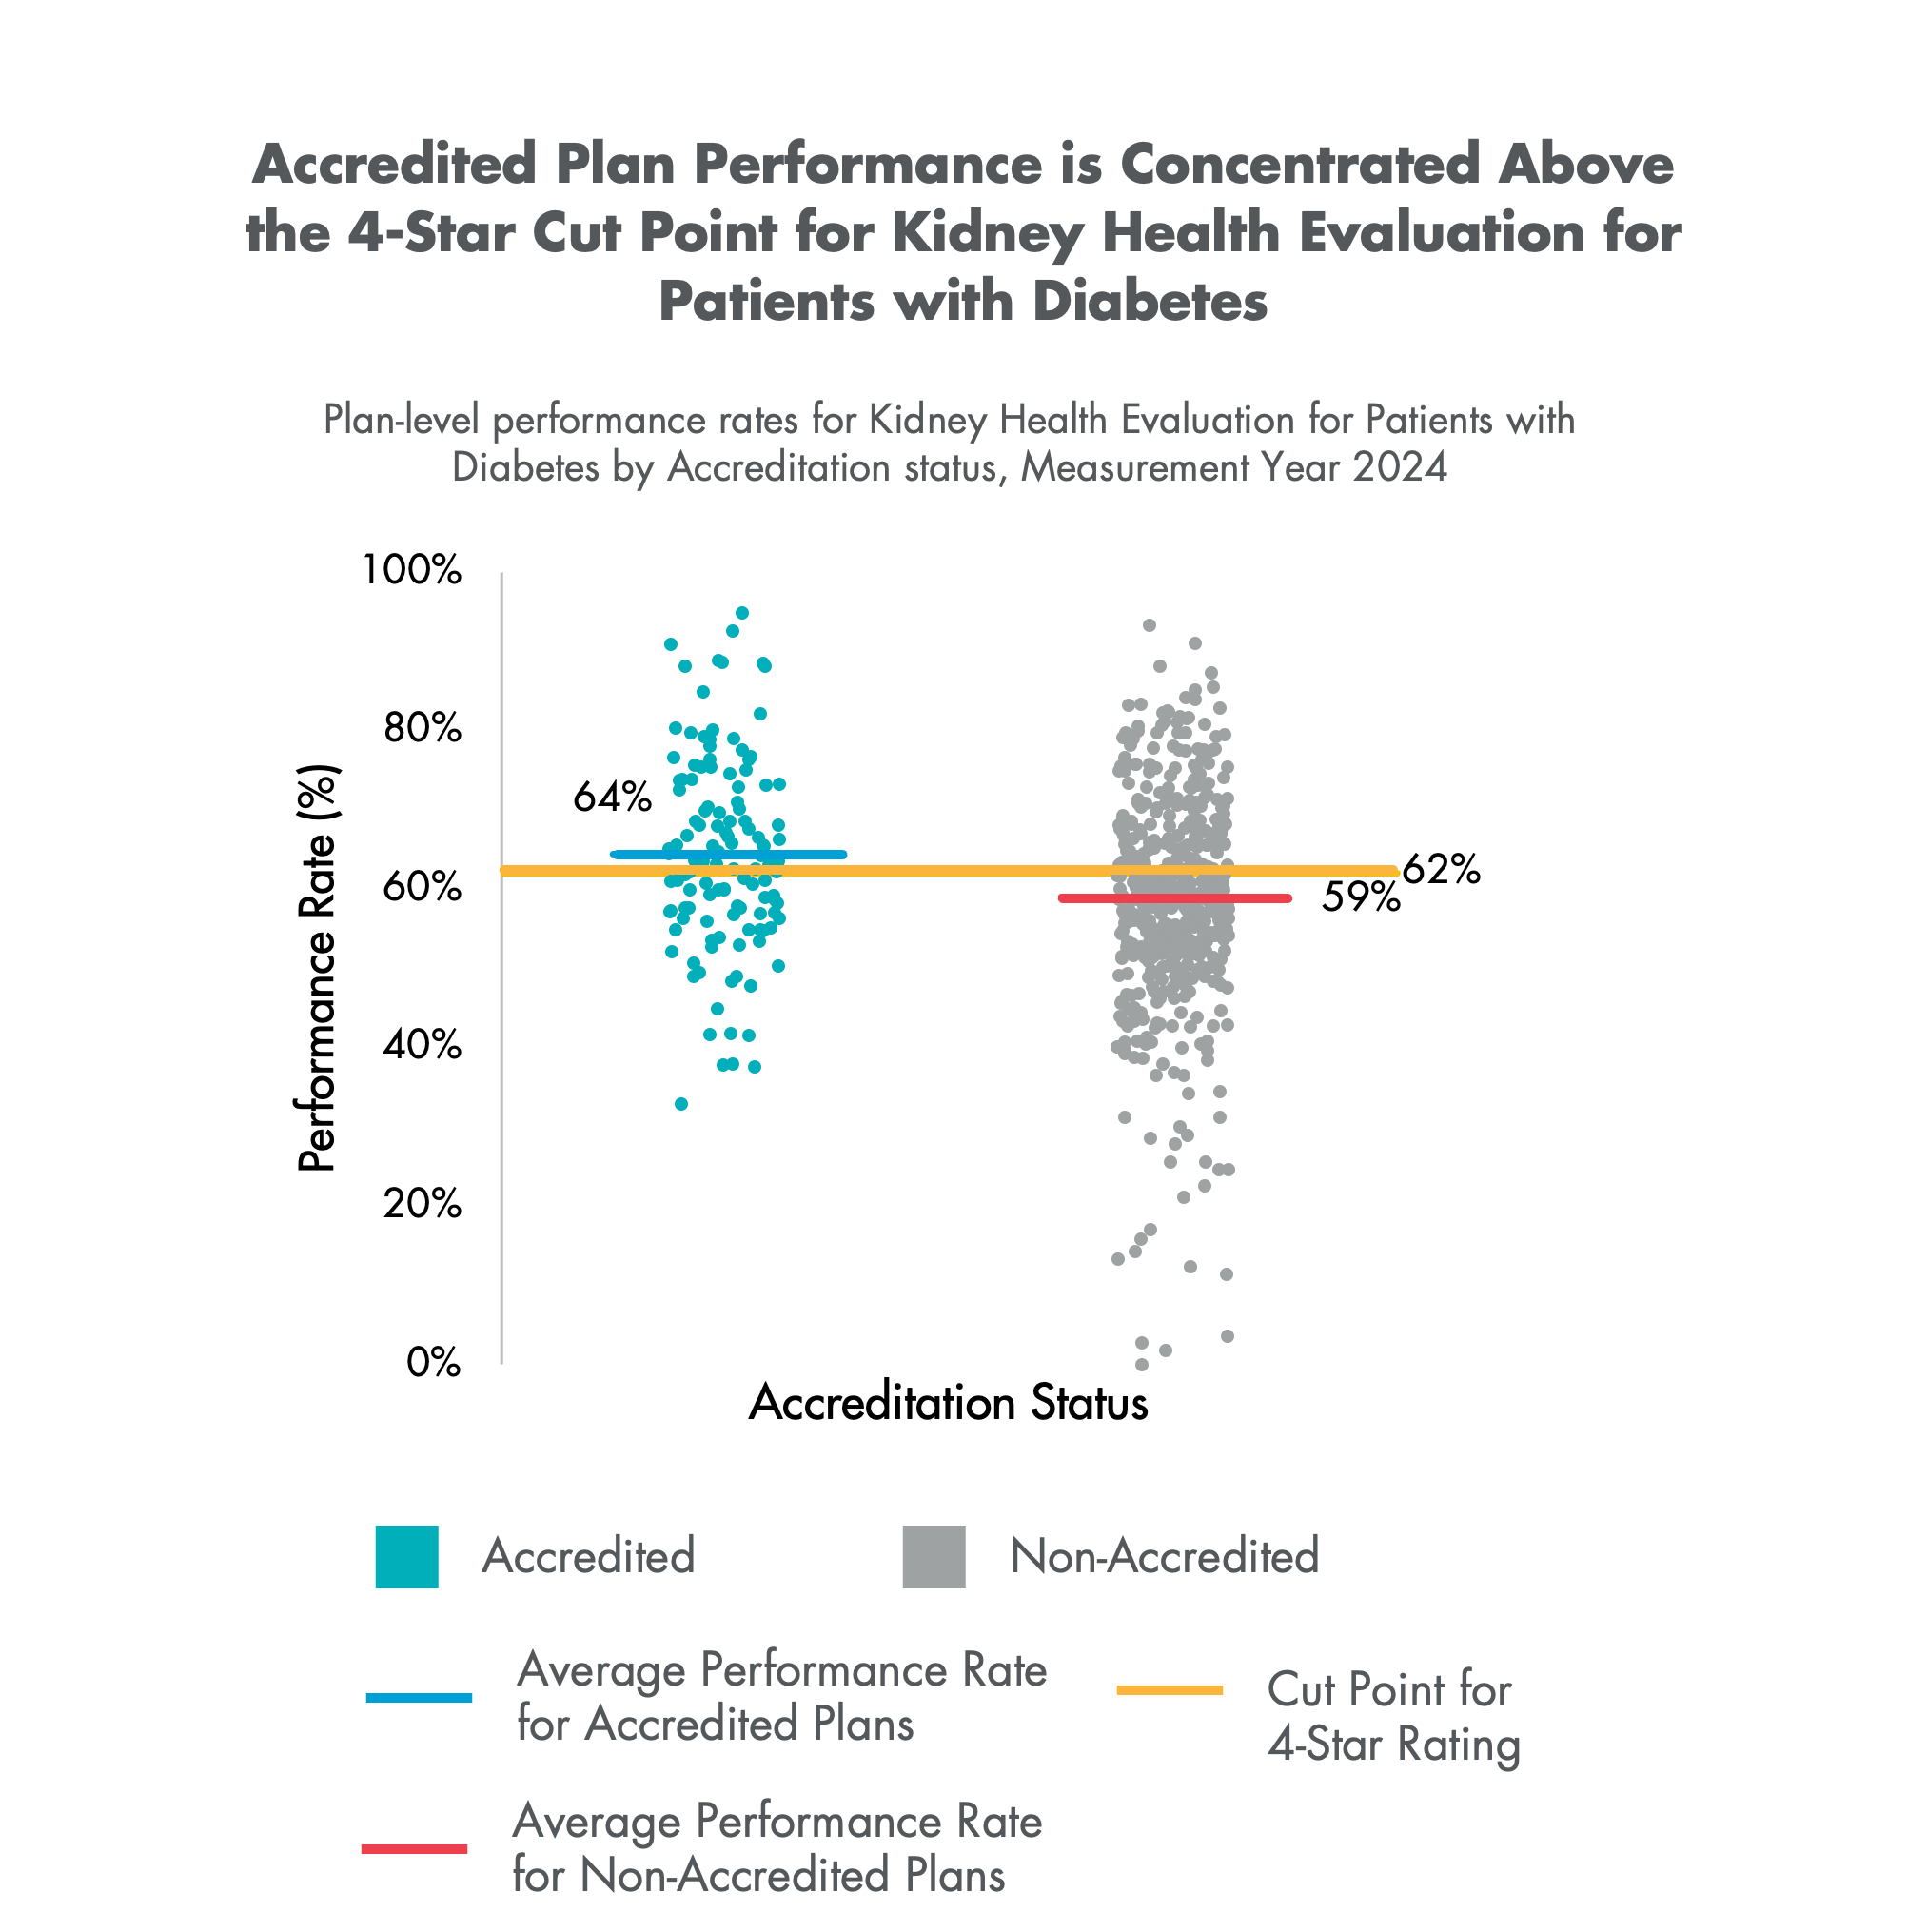
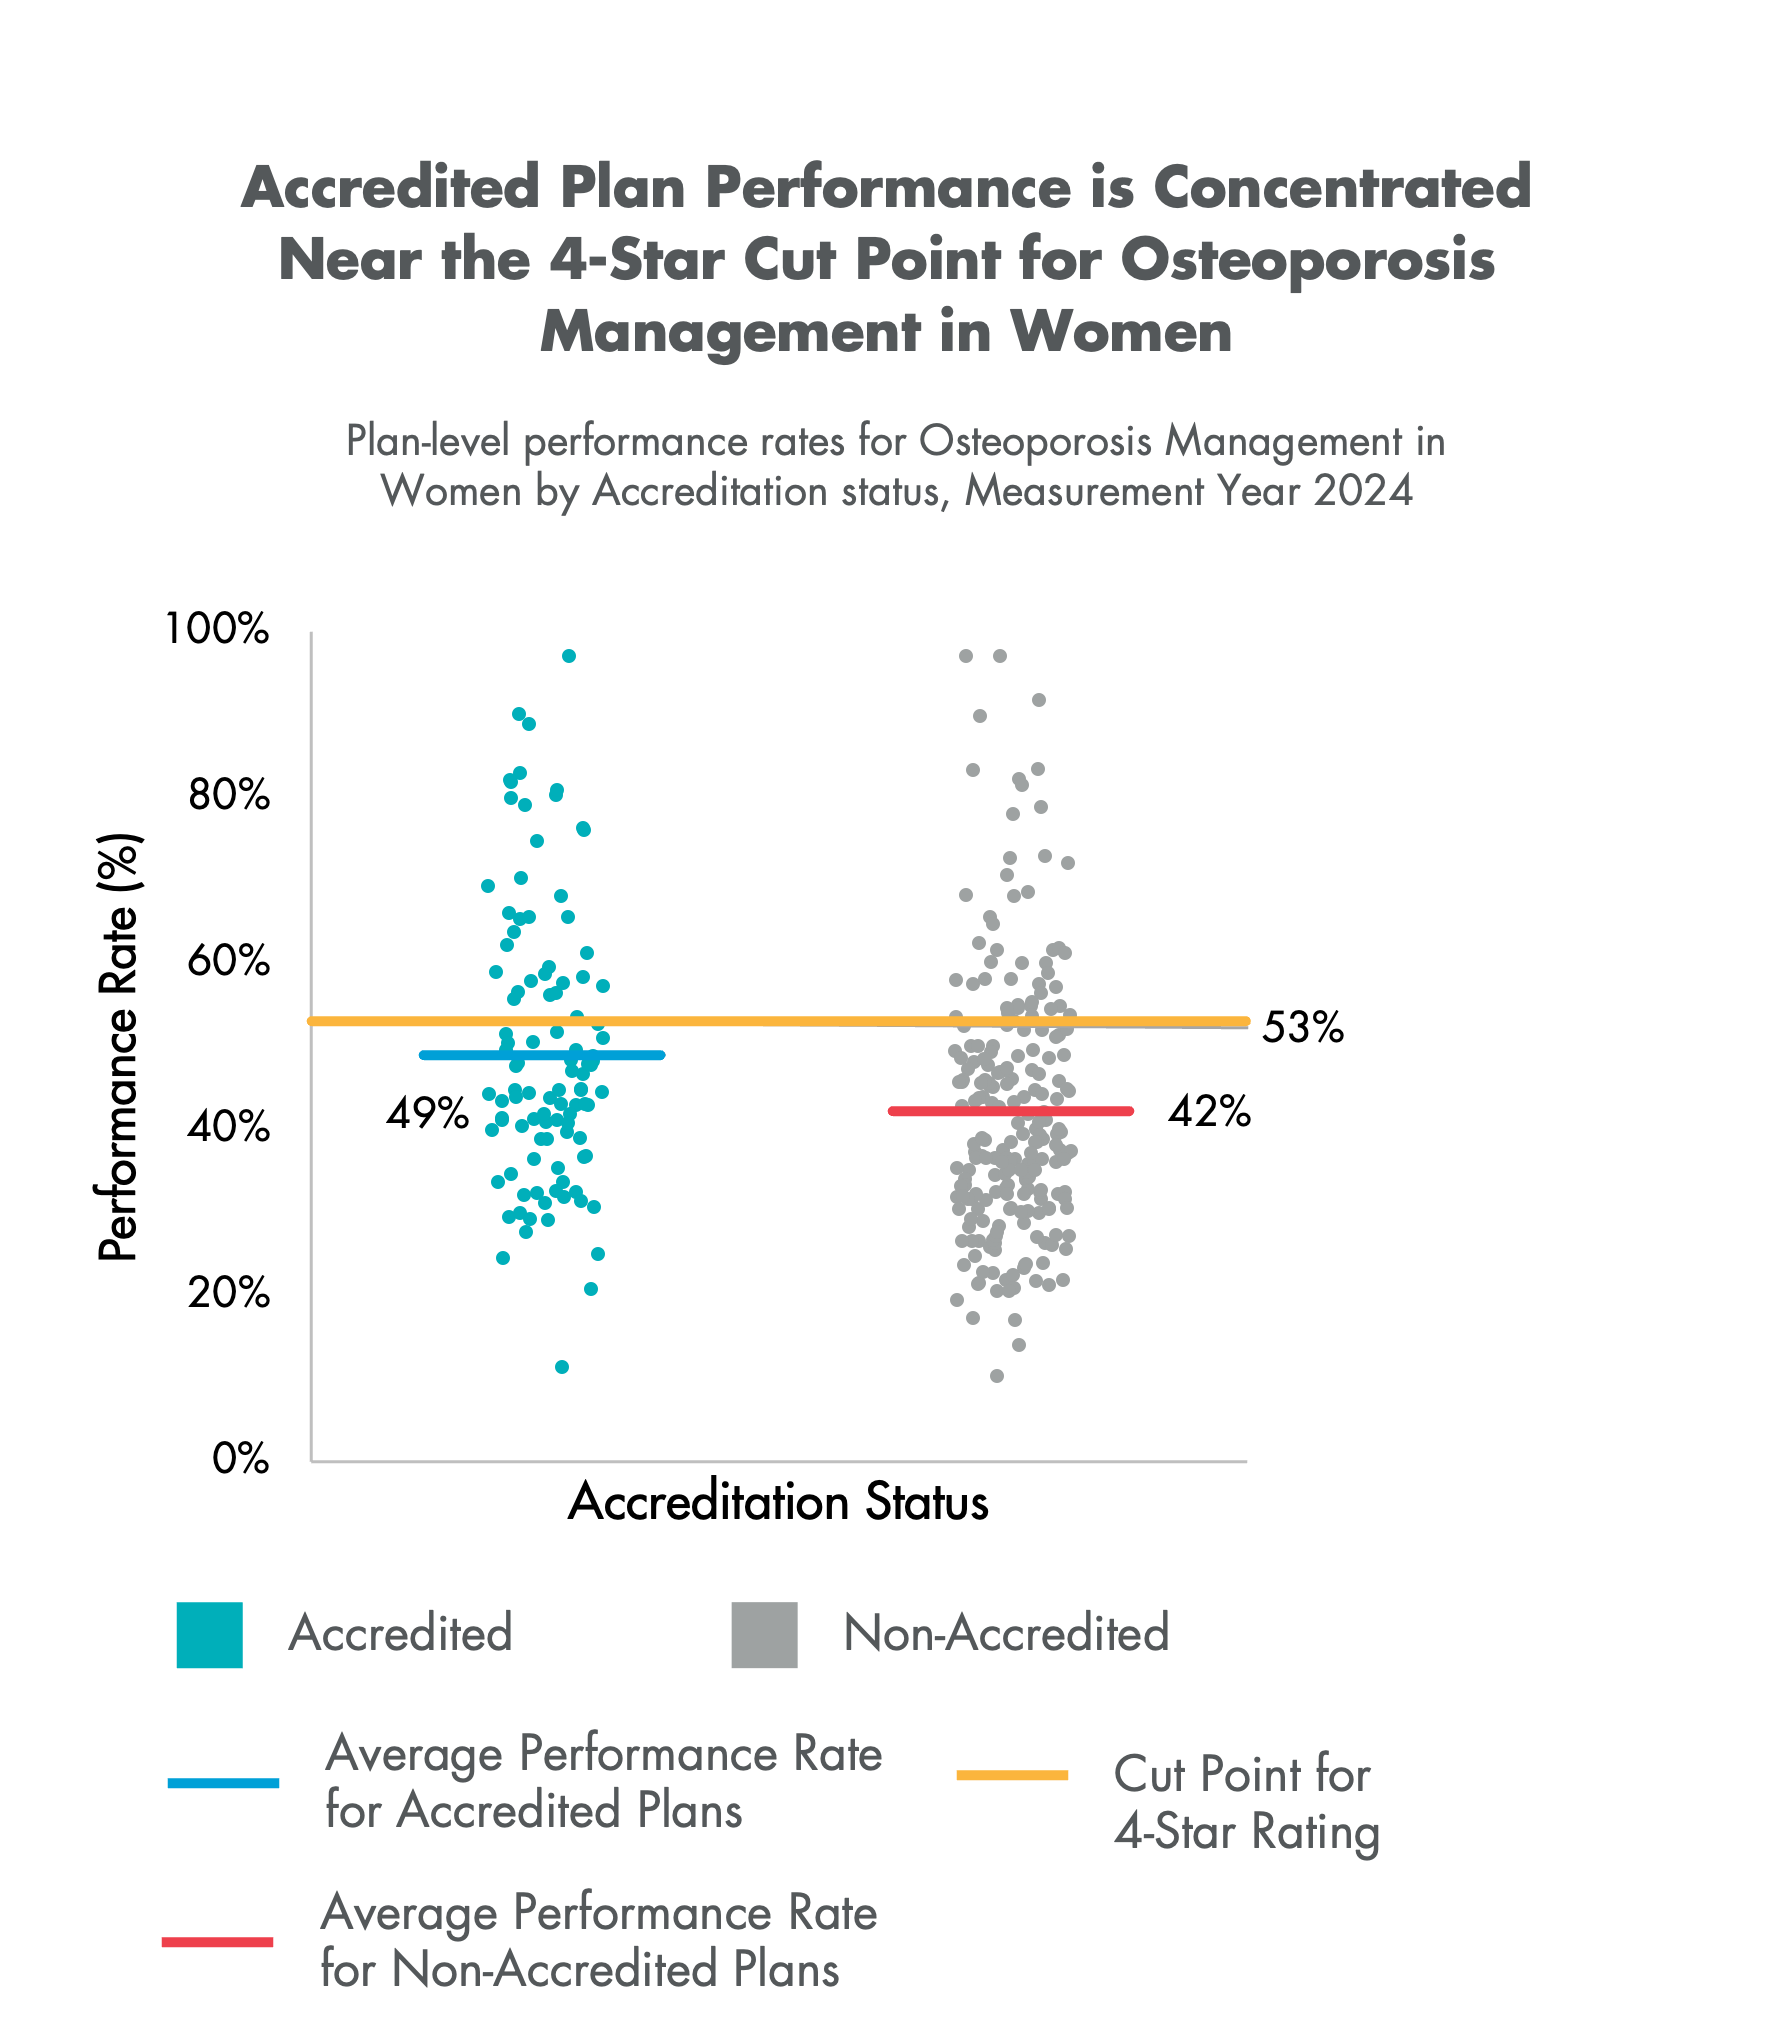
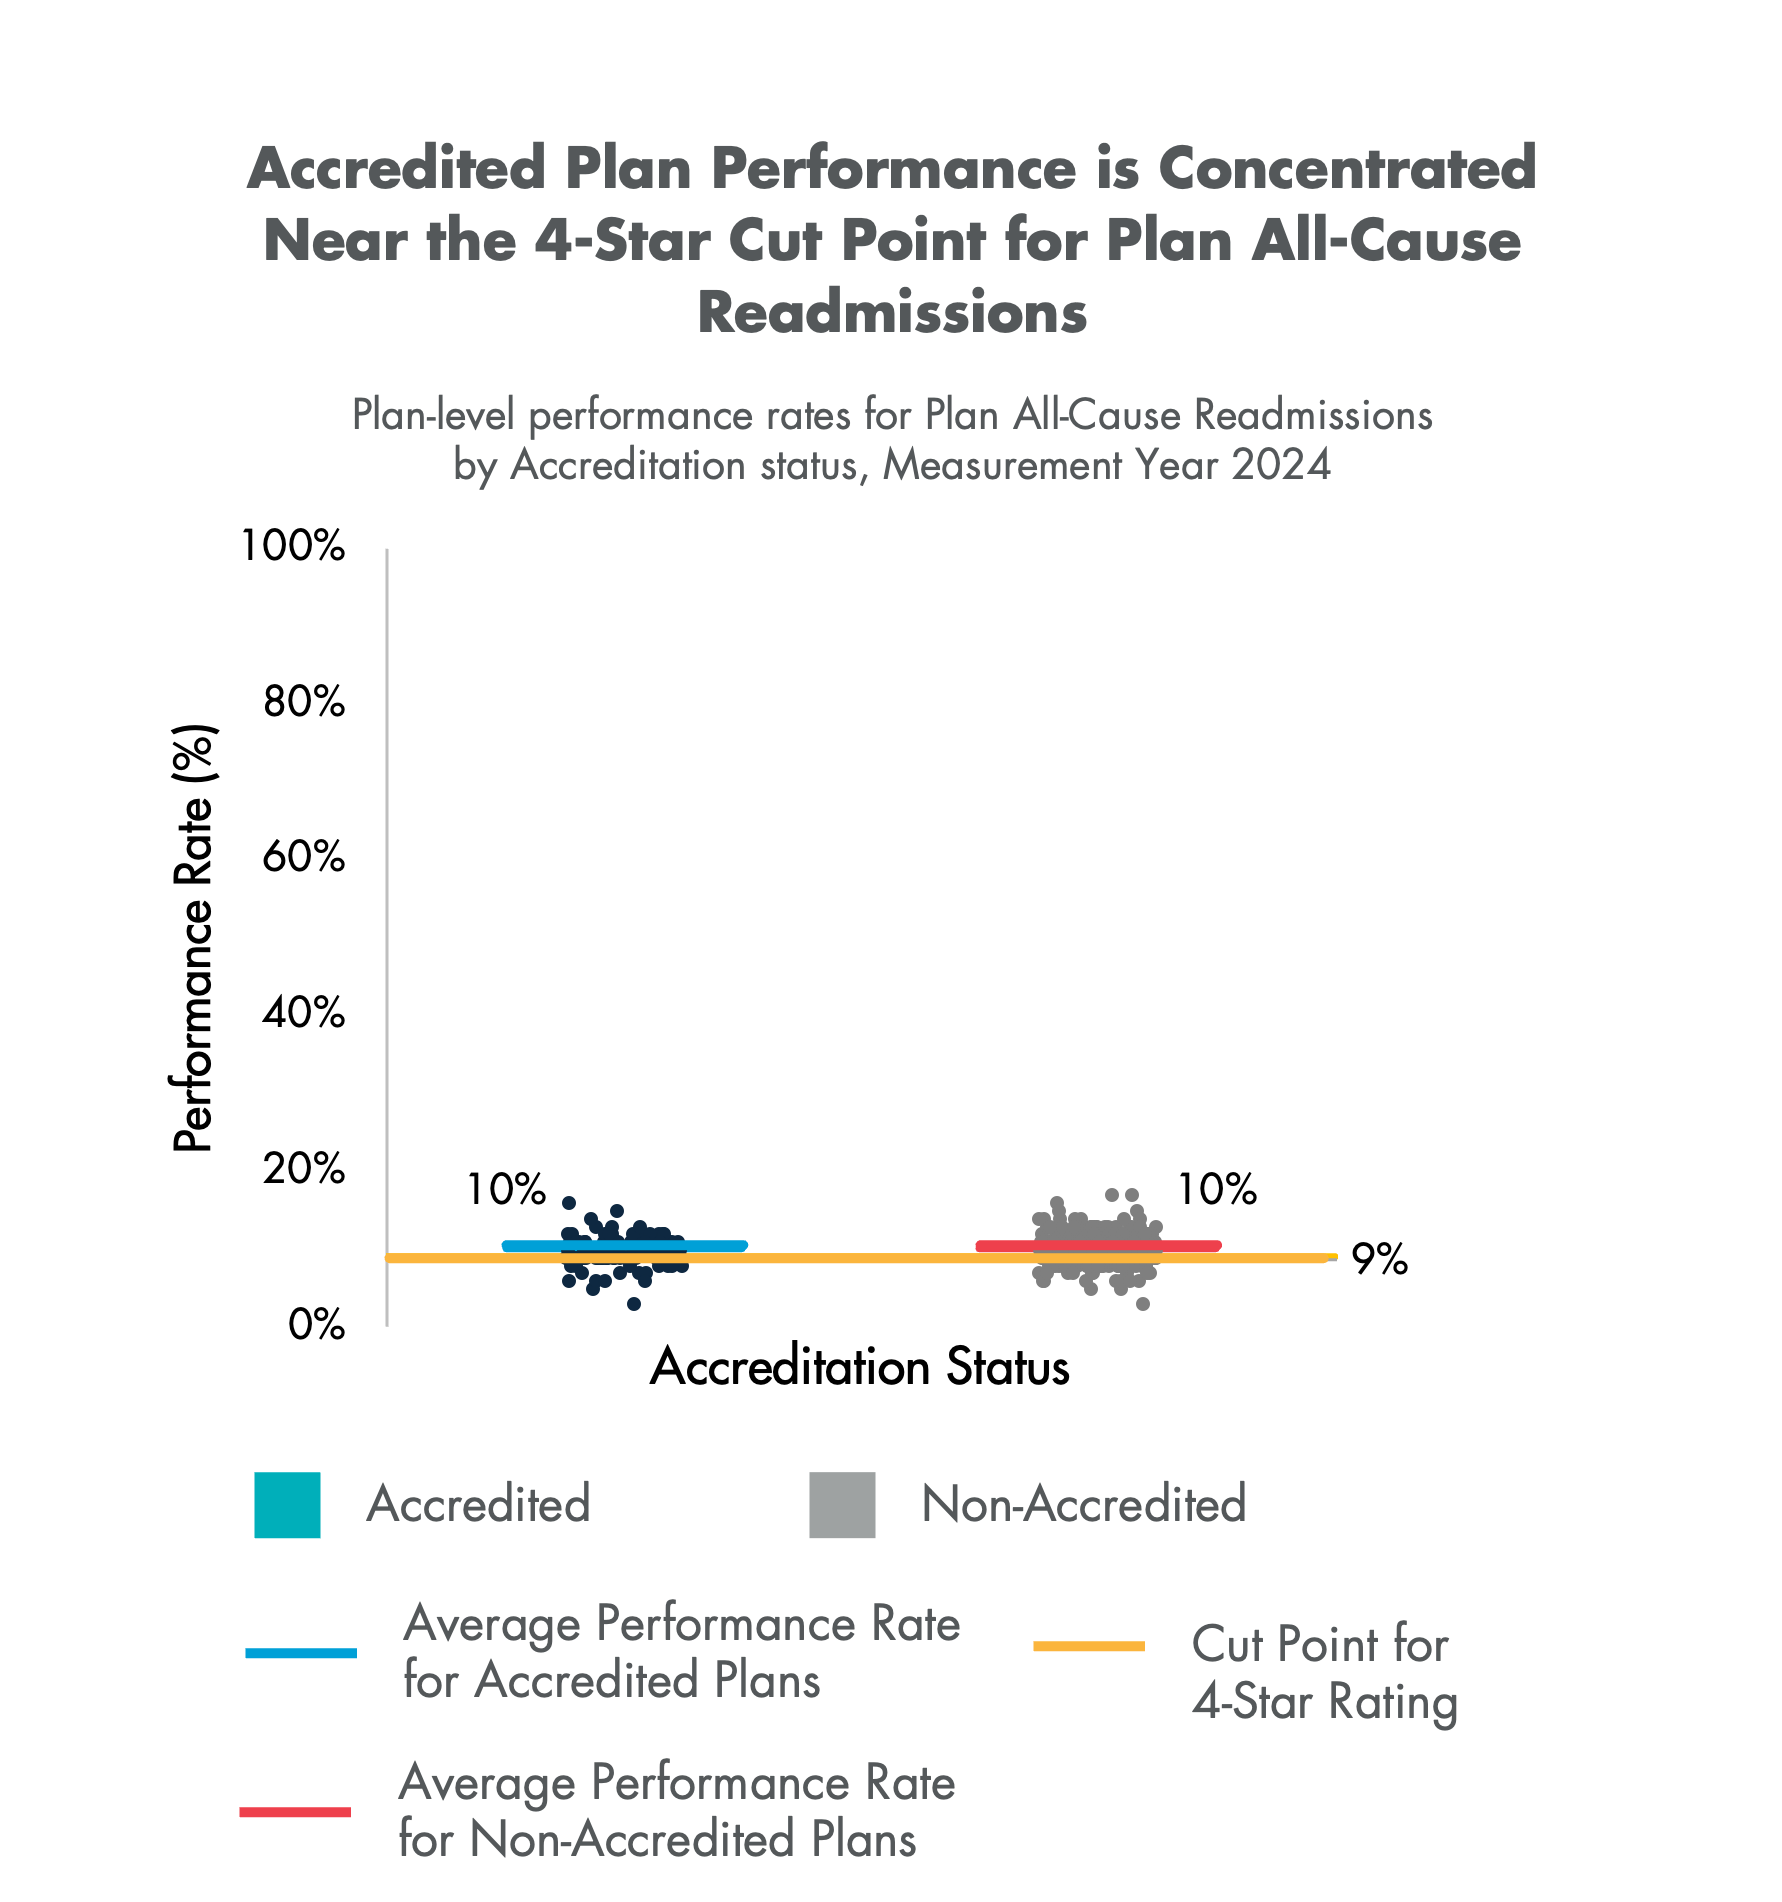
A lower score indicates better performance for this measure. The performance difference is less than 1 percentage point in favor of Accredited plans.
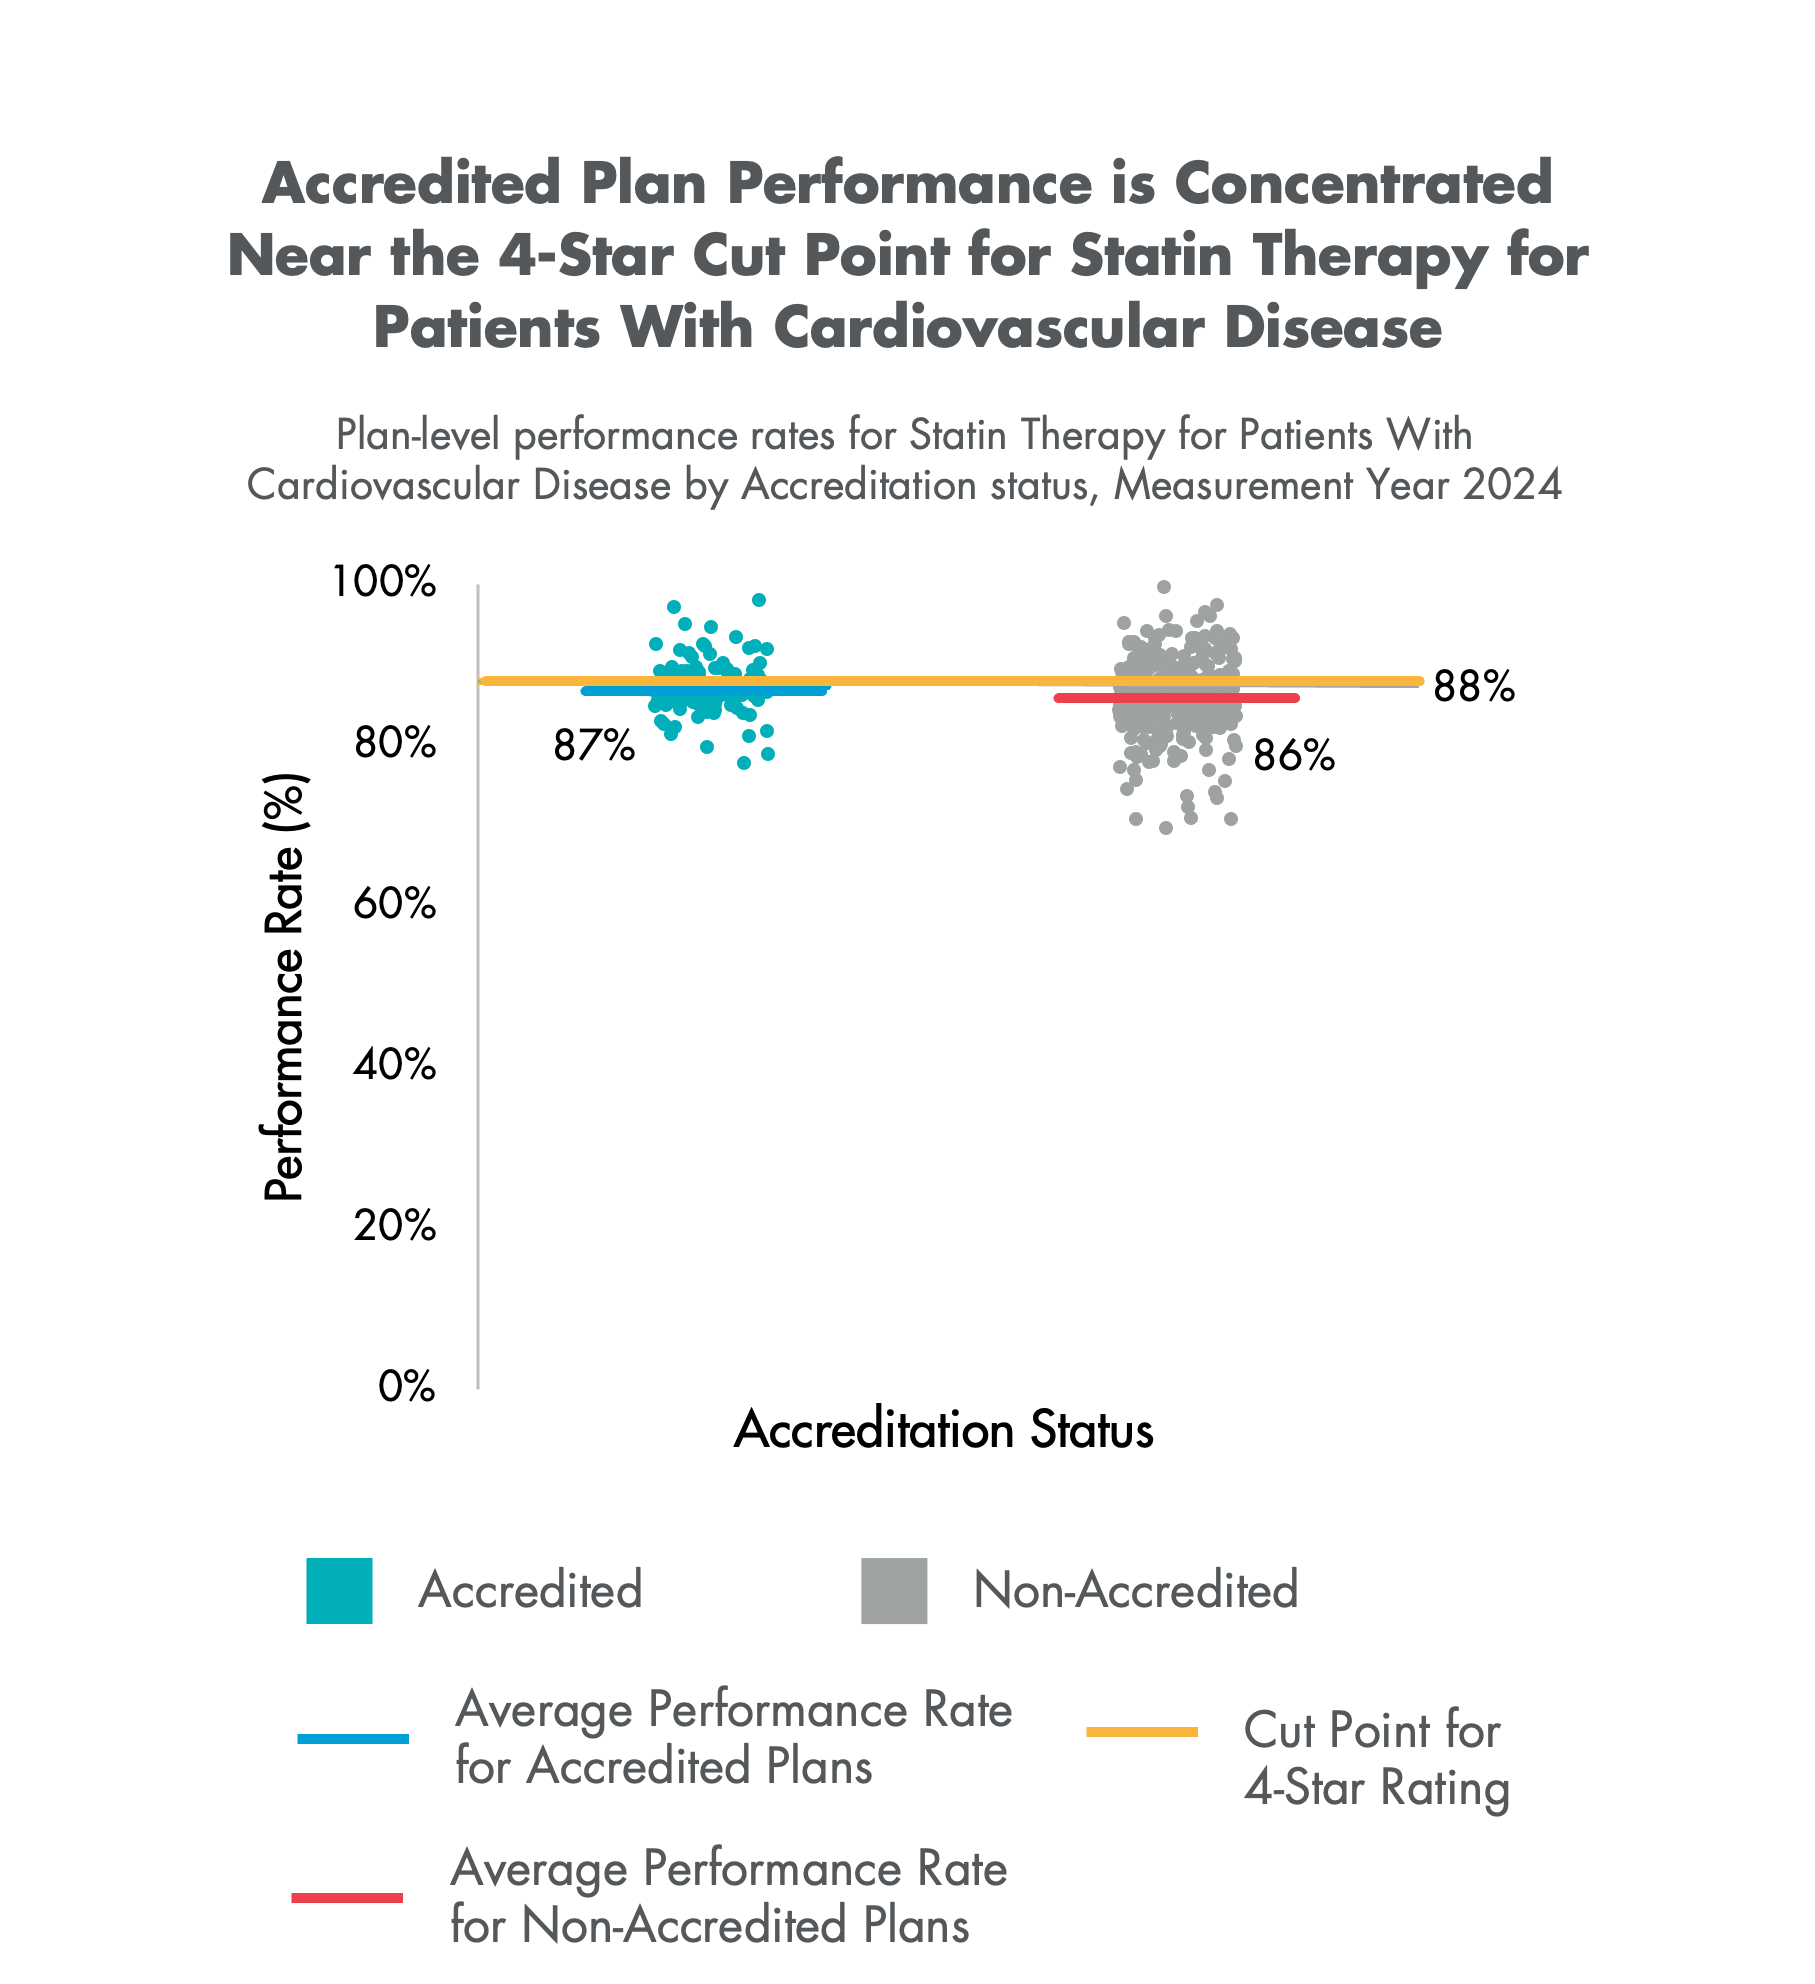
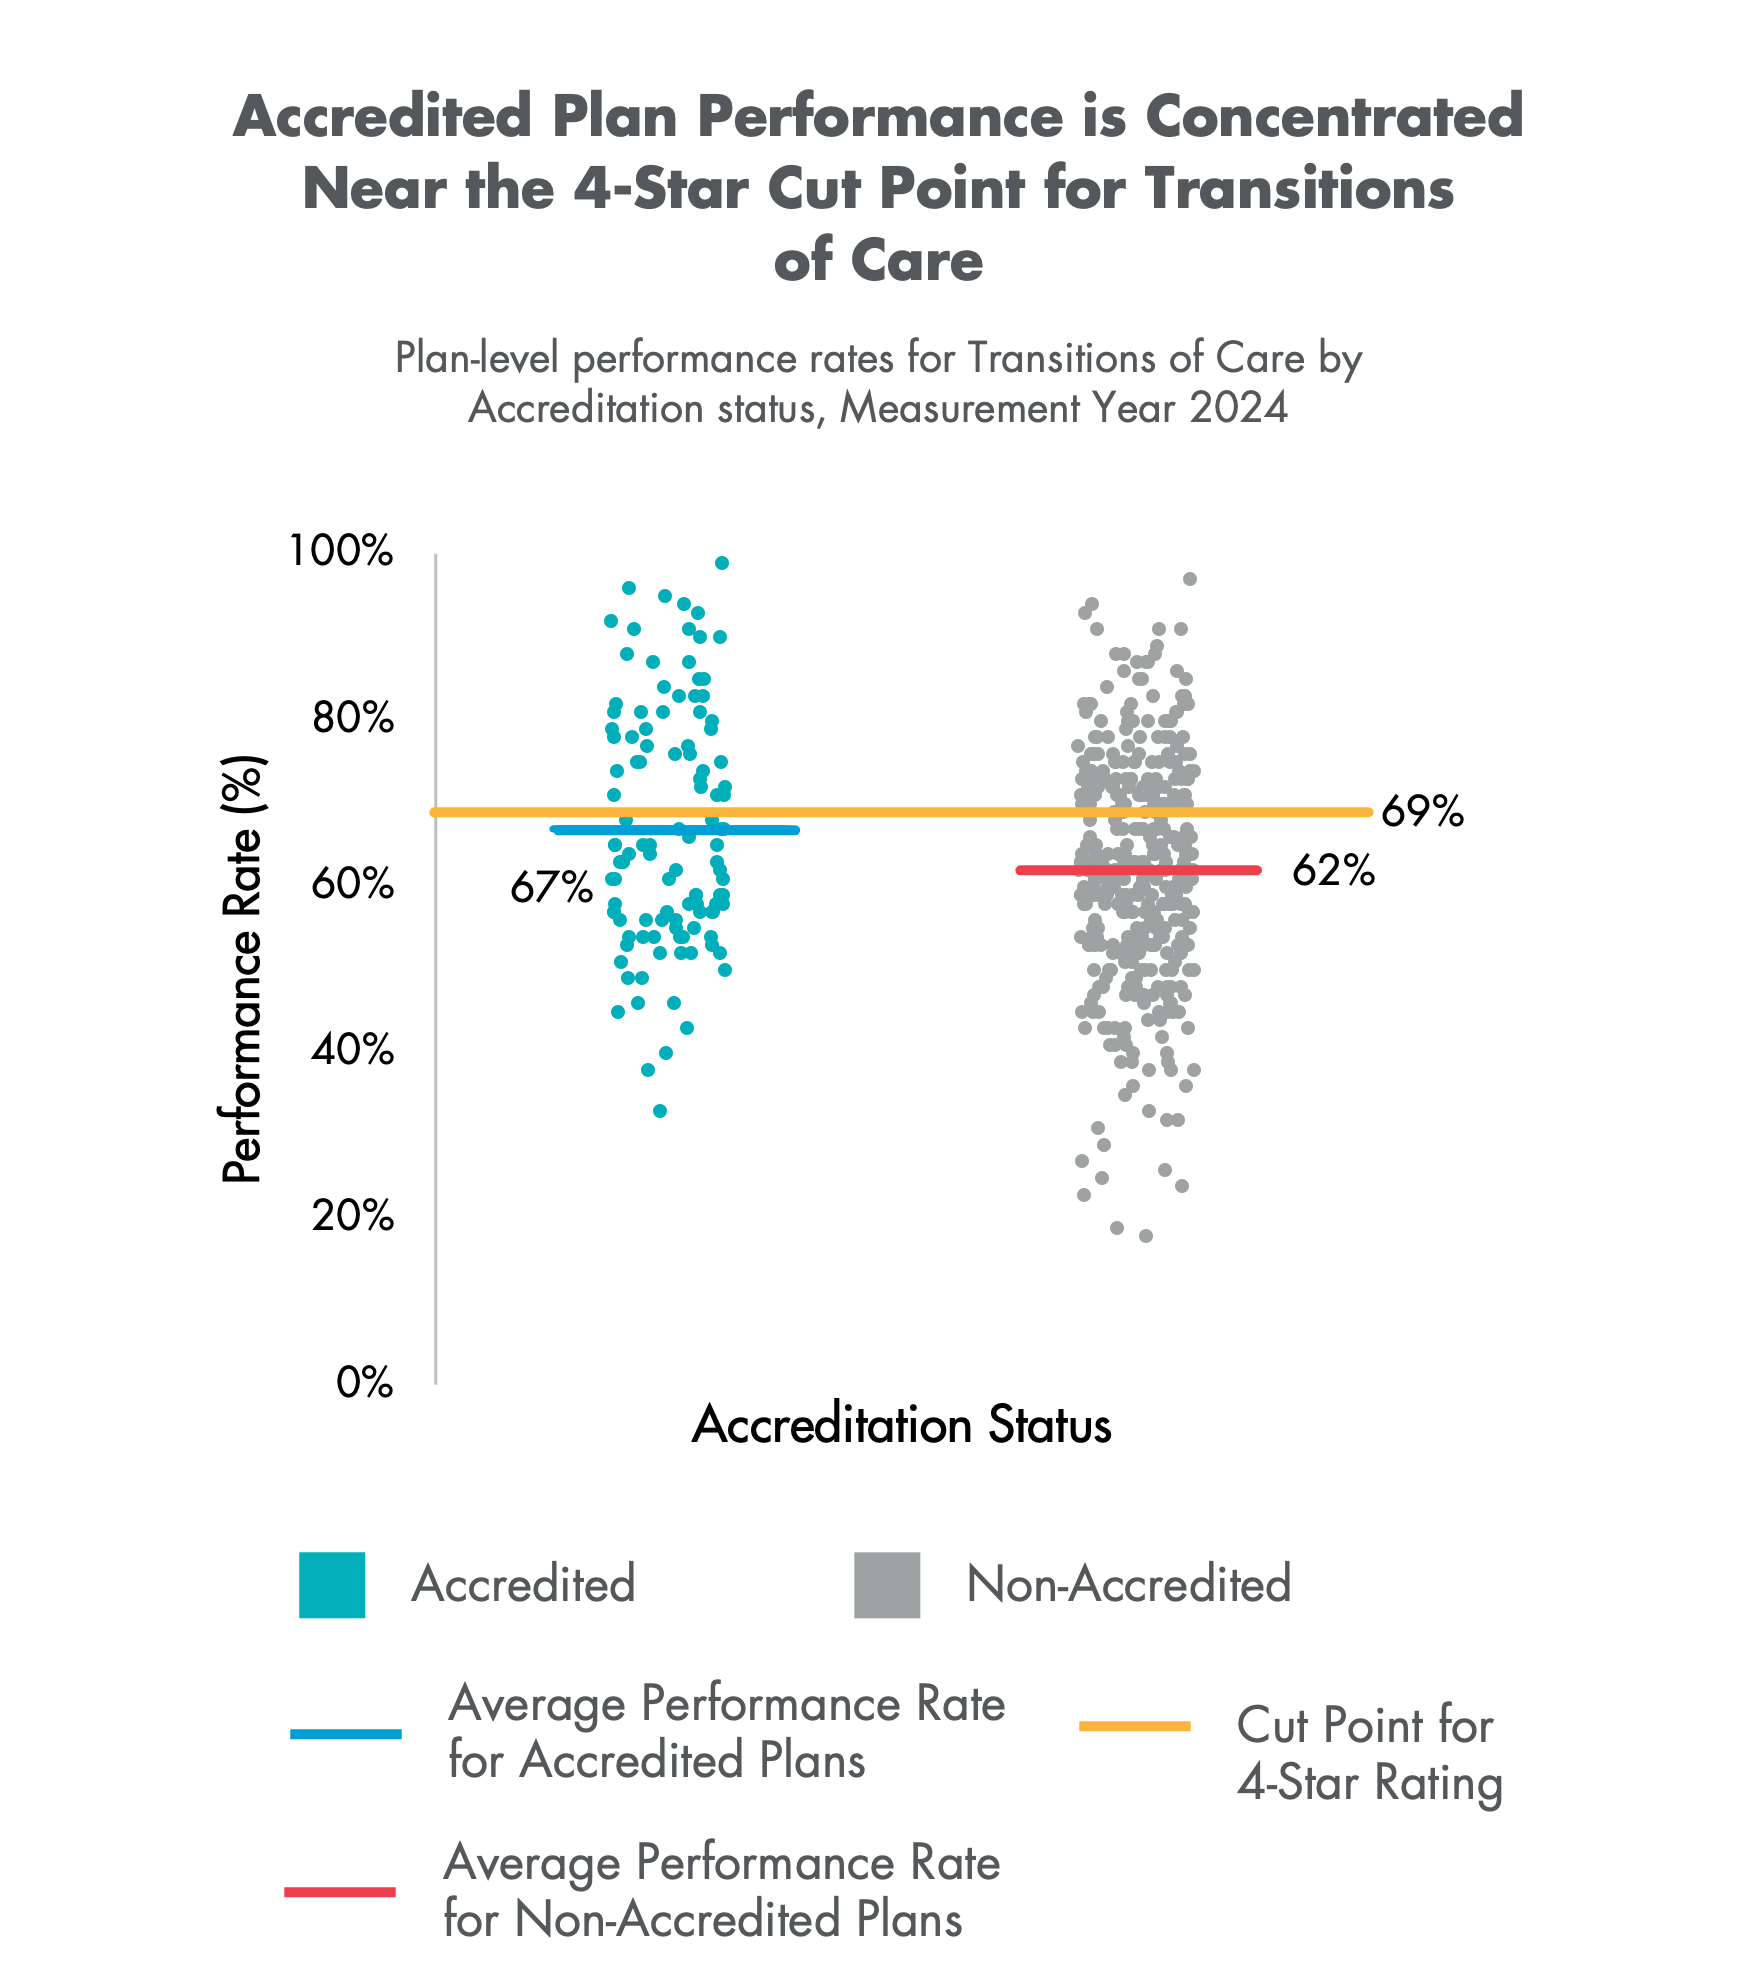
Source: NCQA Accreditation data and CMS publicly reported Star Ratings performance and Star assignment data.1 Real-world impact calculation inputs are based on findings from research studies related to the HEDIS measures in the CMS Star Ratings and the results are calculated for Measurement Year 2024. All studies are referenced on our methods page at: https://www.ncqa.org/accreditation-advantage-methods.
Similar to the HEDIS measures, most CAHPS measures show that Accredited plans trend toward better performance, but with greater variability and smaller differences. Even small variations can be significant for plans that sit close to a cut point in the Star Ratings.
| CAHPS Measure | Accredited Avg | Non-Accredited Avg | Performance Gap (percentage points) |
|---|---|---|---|
| Flu Vaccine* | 69.23% | 65.75% | +3.48 |
| Health Plan Rating* | 87.54% | 86.72% | +0.82 |
| Health Care Quality* | 87.18% | 86.63% | +0.55 |
| Customer Service | 90.53% | 90.23% | +0.30 |
| Getting Care | 81.49% | 81.25% | +0.24 |
| Getting Appointments | 83.88% | 83.83% | +0.05 |
| Care Coordination | 87.24% | 87.28% | -0.04 |
Source: NCQA Accreditation data and CMS publicly reported Star Ratings performance and Star assignment data.1

Strong HEDIS and Star Ratings performance is rarely the result of a single program or intervention. It requires a long-term investment in data, infrastructure and clinical programs to improve the health of members and communities. NCQA interviewed quality and clinical leaders from high-performing Accredited MA plans and several common themes emerged.
The most successful MA plans view quality as an organizational responsibility, not the work of a single department. Leaders prioritize quality from the top down and create shared accountability for outcomes.
Many plans describe Accreditation as a strategic improvement framework—a structured way to identify gaps, strengthen accountability and drive organizational performance.
High-performing MA plans view data as a strategic asset. They are combining multiple streams of information—claims, clinical, provider, pharmacy and member experience data—to create actionable intelligence that supports quality improvement and population health management.
Successful MA plans go beyond traditional claims-based analysis to develop a comprehensive understanding of each member’s health status, risks and needs. The focus shifts from simply identifying care gaps to understanding the barriers that created those gaps and deploying targeted interventions that make it easier for members to receive the care they need.
The strongest plans do not simply encourage clinicians to improve quality performance. They actively equip them to succeed—from providing actionable data to support value-based contracting to investing in equipment and infrastructure to improve access to care.
Many drivers of population health occur outside the walls of traditional healthcare. As a result, high-performing MA plans are investing in community partnerships and programs that address access, health literacy, social needs and member engagement.
Find out how high-performing Accredited MA plans are investing in population health strategies that improve HEDIS and Stars Performance—and how Accreditation serves as a roadmap for success.
NCQA Accreditation is closely aligned with Capital Health Plan’s (CHP) mission to improve the health of the communities it serves. As a longstanding fixture in the community since 1982, CHP operates in nine counties in the Florida panhandle, eight of which are rural, making access to healthcare a significant challenge. Rather than viewing Accreditation as a compliance exercise, the plan uses NCQA’s quality framework to develop programs that bring care closer to members and reduce barriers to accessing needed services.
Because of its relatively small size and deep roots in the community, CHP is able to build personal relationships with members and providers in ways that larger organizations often cannot. Roughly one-third of members receive care from CHP-employed clinicians, while two-thirds are served by affiliated practices. This hybrid model allows CHP to align quality strategies across both employed and affiliated practices, creating consistency in how care gaps are identified and closed.
“Our quality improvement program for NCQA Health Plan Accreditation feeds directly into our population health strategies. Through those programs, we gather documentation to show how we are improving the health of the community, which is one of our key pillars. It all ties together.”
Mary Goble, Former Director, Clinical Quality and Performance Improvement Department, Capital Health Plan
NCQA Accreditation standards help guide the programs and partnerships that define CHP’s population health approach. The plan has made strategic investments that improve access to care in the rural communities it serves by bringing resources directly to practices and community settings.
Capital Health Plan exceeded the CMS 4-Star cut point for nine HEDIS measures included in the CMS Star Ratings in MY 2024.
“As a primary care provider, I rely on HEDIS measures to help me deliver consistent, evidence-based care for patients living with chronic conditions. For these patients, preventive care is not separate from treatment; it is an essential part of managing conditions like diabetes, hypertension, and COPD. By focusing on prevention through HEDIS, I can help patients stay more stable, avoid unnecessary hospitalizations and improve their long-term health and quality of life.”
Dr. Cielo Rose, Physician Manager at the Nancy Van Vessem Center for Healthy Aging, Capital Health Plan
For Capital District Physicians’ Health Plan, Inc. (CDPHP), quality improvement is not a department. It is an organization-wide commitment that impacts every member interaction, provider partnership and strategic decision. A regional health plan serving just under 74,000 Medicare Advantage members in upstate New York, CDPHP has built a comprehensive approach to population health that combines data-driven interventions, close provider collaboration and a deeply embedded culture of quality.
At the center of that strategy is NCQA Health Plan Accreditation. Rather than treating Accreditation as a compliance exercise, CDPHP uses NCQA standards as the foundation for continuous improvement and a roadmap for delivering better care and outcomes.
“When you are an NCQA Accredited entity, you are demonstrating a high standard of commitment to your members. It shows that you are willing to go through scrutiny and validation by NCQA to become the best health plan you can be. NCQA Accreditation is the roadmap or guidebook to get you there.”
Cynthia Farrelly, Manager, Quality Program Governance, CDPHP®
CDPHP’s quality improvement strategy begins with understanding its population and identifying areas where members need the most support. Its investments in population health range from technology and analytics to member outreach and provider engagement.
CDPHP exceeded the CMS 4-Star cut point for six HEDIS measures included in the CMS Star Ratings in MY 2024.
“People come up to me and ask, ‘How do you do it?’ It’s like they’re looking for the secret sauce. I tell them that the secret sauce is that everyone has to be invested. Everyone has to own it. Everyone has to come to work every day knowing this is what we need to do.”
Michael Farina, Vice President, Healthcare Quality, CDPHP®
For Geisinger Health Plan (GHP), improving quality starts with a simple but powerful philosophy: care for the whole person, not just a diagnosis. That means addressing clinical needs alongside behavioral health, social determinants of health and barriers to care. GHP is part of Geisinger, an integrated healthcare delivery organization that serves communities across Pennsylvania. Its goal is to be the best by providing exceptional care to all and leading healthcare forward.
NCQA Accreditation can serve as an engine for quality improvement. By providing a structured framework for population health management, performance measurement and organizational accountability, Accreditation helps transform quality initiatives into measurable gains in HEDIS performance, Medicare Star Ratings and member outcomes.
“We’ve been on a bit of a journey with population health and the one thing we really focus on is whole-person care. It is important to meet our members where they are, and where they want us to meet them.”
Erin Griffith, Director, Quality Management, Geisinger Health Plan
GHP’s population health approach extends well beyond traditional case management. It requires an understanding of the needs of the entire population. The plan has invested in programs that bring care directly to members, address social needs and provide highly specialized care for members with complex needs.
GHP exceeded the CMS 4-Star cut point for seven HEDIS measures included in the CMS Star Ratings in MY 2024 for its HMO plan and eight measures for its PPO plan.
“Our Star Ratings reflect thousands of daily actions focused on keeping people healthy and engaging them in their care. It’s about the care we wrap around our members, how we use data to drive our decisions and how we try to personalize care as much as we can.”
Eileen Evert, Senior Director, Quality and Accreditation, Geisinger Health Plan
For more than two decades, Network Health has built its Medicare Advantage strategy around a simple belief: quality is everyone’s responsibility. NCQA Accreditation enables alignment and integration, with clear lines of accountability from executive leadership to analytics teams, care managers, provider partners and community outreach staff. The organization has created a culture of quality where everyone understands that quality is just as important as paying claims or providing excellent customer service.
Network Health sets an ambitious target of 5 Stars for the CMS Medicare Star Ratings and NCQA’s Health Plan Ratings as part of its annual company-wide goals, so every employee has a stake in the results. That organization-wide commitment has helped Network Health achieve strong performance while continuously expanding programs designed to improve health outcomes for Wisconsin communities.
Network Health’s population health strategy focuses heavily on chronic disease prevention and management, particularly for conditions like diabetes and hypertension. Its leaders view HEDIS performance, Star Ratings and Accreditation excellence not as separate goals, but as interconnected elements of a broader commitment to helping people achieve better health.
Network Health Plan exceeded the CMS 4-Star cut point for eleven HEDIS measures included in the CMS Star Ratings in MY 2024.
“NCQA requirements ensure that Network Health has a strong quality program across all departments. Each standard element has a designated owner and that person is responsible for developing their work plan and evaluating the results, which includes quantitative analysis and qualitative analysis of their interventions and how well they worked.”
Sara O’Neill, Director of Quality Health Integration, Network Health
Priority Health has achieved success in HEDIS and Star Ratings by building a collaborative quality improvement structure, making data-driven decisions and putting members and clinicians at the center of everything it does. Priority Health leaders view NCQA Accreditation not as a compliance exercise, but as a framework that helps organizations build sustainable quality improvement programs.
Quality starts with a strong organizational and governance structure. Priority Health’s quality improvement function is closely integrated with population health, Accreditation and HEDIS operations. These functions report through the same leadership structure, allowing teams to analyze performance data collaboratively, identify opportunities and develop targeted interventions for specific populations.
“NCQA’s Health Plan Accreditation is a pathway for quality improvement. It provides a certain level of guidance and gives us an extra push to make sure we complete the full cycle of quality improvement. It makes quality everyone’s business.”
Alexandria Tusek, Director of HEDIS and Accreditation at Priority Health
Priority Health developed a process called Next Best Action that drives its member outreach activities. At the beginning of the year, the team analyzes its population to identify members that fall within the denominator for each HEDIS measure used in the Star Ratings. Outreach approaches vary based on each member’s health condition and other circumstances, but generally follows this hierarchy:
“There are a lot of barriers to getting a colonoscopy, whether it is related to appointment wait times or members being unwilling to do the preparation. We know that if we can get a home test kit into the member’s hands and they can just drop it off at their local lab or put it in the mail, they are much more likely to complete the screening.”
Ian Straayer, Former Director of STARS at Priority Health
The key to success for the Next Best Action outreach is the continuous flow of claims and chart review data into Priority Health’s systems so the teams can conduct targeted outreach to support the members who need it most.
Priority Health exceeded the CMS 4-Star cut point for eight HEDIS measures included in the CMS Star Ratings in MY 2024 for its HMO plan and seven measures for its PPO plan.
For UPMC Health Plan, NCQA Accreditation supports a whole-person approach to care and better outcomes. As part of the University of Pittsburgh Medical Center (UPMC) integrated health care delivery system, UPMC Health Plan is committed to providing its members with better health, more financial security and the peace of mind they deserve.
Today, the health plan serves approximately 226,000 Medicare Advantage members across multiple plan offerings while maintaining a strong focus on population health and quality improvement.
“From my perspective, the value is that Accreditation really encourages us to move beyond good intentions and helps us demonstrate that we have a reliable structure for understanding our population, identifying gaps, acting on those gaps and working to sustain improvement over time.”
Lisa Gerdes, Director, Quality Improvement, UPMC Health Plan
At UPMC Health Plan, population health is not viewed as a collection of individual programs. Instead, it is an integrated strategy that brings together clinical teams, care management, quality improvement, analytics, providers, pharmacy and community engagement staff to address the needs of members holistically.
NCQA Accreditation provides a framework that helps align these efforts and turn quality goals into sustainable practices, such as:
“Once you hit a certain performance level, I think you have addressed all your low-hanging fruit opportunities. NCQA has got us thinking about different populations and the people we’re missing. We have seen big improvements in our Star Ratings and quality performance because of how we have been able to come together and focus not just on the individual measures, but on our overall population health strategy and engaging with those high-risk populations.”
Mariah Osborn, Director, Medicare Stars, UPMC Health Plan
“During last year’s annual enrollment our plan nearly doubled in size, and that’s been a huge eye-opener for us because we are bringing on new members with limited information about their health history. That’s where our laser-focused quality programs are helping us to quickly assess the population and get the care they need.”
Vice President, Quality and Clinical Integration
at a Medicare Advantage Plan

In the Medicaid, commercial and exchange markets, Accreditation is a standard used to set a quality bar—built into contracting, procurement and participation requirements. Plans use it to differentiate, demonstrate operational discipline and win business. In Medicare Advantage—the line of business with high financial stakes through Star Ratings and bonus payments—the rate of Accreditation is the lowest.2–4
This Accreditation gap represents substantial untapped potential for better cost control for plans and meaningful savings for the government entities that fund care.
Source: NCQA Accreditation and HEDIS data and publicly reported enrollment reports.
These findings point to specific actions for plans and policymakers who want to close performance gaps, reduce financial risk and improve outcomes.
HEDIS® is a registered trademark of the National Committee for Quality Assurance (NCQA).
CAHPS® is a registered trademark of the Agency for Healthcare Research and Quality (AHRQ).